Share Value Price Trend
Share Value Price Trend provides unique insight to improve share trading and investment performance.
As of May 2026, Share Value Price Trend has 84 users and a 3.00/5 rating from 3 reviews.
Usersno change0%
84
84
Ratingno change0%
3.00
3 reviews
Reviewsno change0%
3
Version
2023
Manifest V3
History
2 snapshotsTracking since Apr 23, 2026.
View as table
| Date | Users | Rating | Reviews | Version |
|---|---|---|---|---|
| Apr 23, 2026 | 84 | 3.00 | 3 | 2023 |
| May 19, 2026 | 85 | 3.00 | 3 | 2023 |
| Now | 84 | 3.00 | 3 | 2023 |
Permissions & access
- Permissions
- None declared
- Host access
- None declared
Screenshots
About
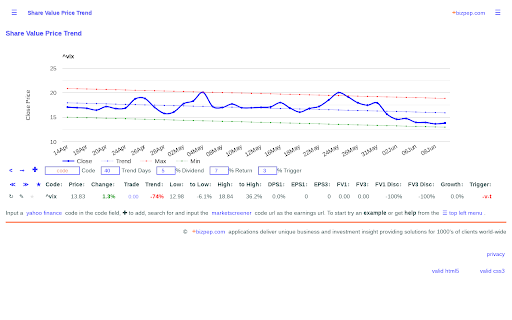
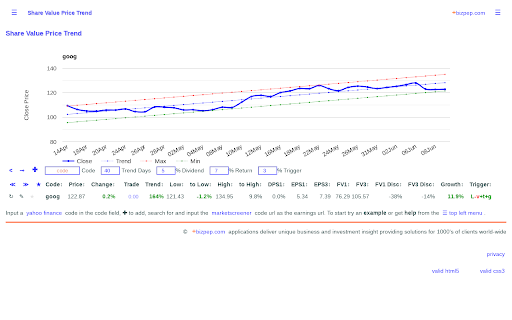
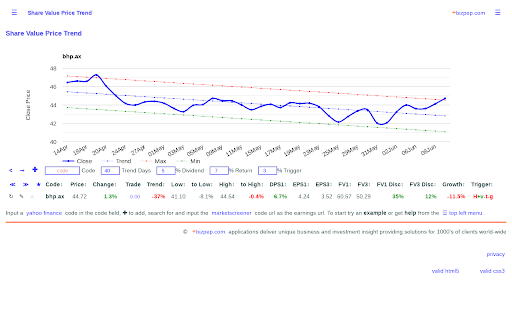
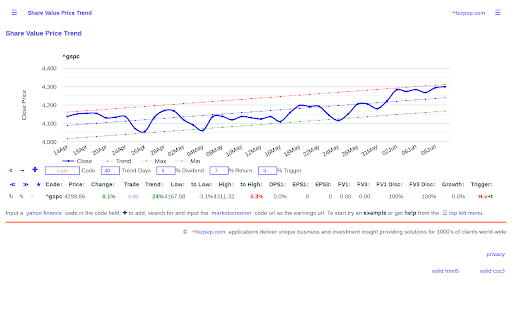
Share Value Price Trend provides unique insight to improve share trading and investment performance with share price fair value calculations for current and future years, share and index price trend analysis and high / low triggers to identify value buy / sell trade points. Share Value and Price Analysis provides further share value and price analysis detail.

It uses yahoo finance data for current and historical share prices and index levels. Estimated future share earnings (eps) and dividends (dps) from marketscreener are applied to identify future fair value share prices, current price discounts and dividend returns. This provides a basis for direct comparison of the future share price value.

Trend analysis is applied to historical share and index data to calculate trend range with high and low trend points, the trend days duration of trend analysis can be adjusted to review changing trends. Trade trigger points are identified using High / Low trend prices, estimated future value, annual trend slope and growth. Trade input for each code provides a record of target trades.

Data calculations include:

Indicative annual Trend % based on the historical close value over the Trend Days, positive Trend is green, negative Trend is red.

Trend High and Low values and % change from current. to Low% less than % Trigger are green indicating a buy level, to High% less than % Trigger are red indicating a sell level. On mouseover or click to Low and to High display the High or Low value.

Dividend per share % DPS for year 0 actual, and year 1 to year 3 estimates. When DPS % > % Dividend text is green.

Earnings per share EPS year 0 to year 3 are provided. On mouseover the payout ratio; the amount of earnings paid as dividends; and pe ratio are displayed.

Fair Value price FV year 0 to year 3 is calculated based on the required % Return, FV = EPS / % Return.

Fair Value Discount % FVDisc year 0 to year 3 is calculated, FVDisc = ( FV - Current Value ) / Current Value. The Fair Value Discount % indicates the level of current value. When current price is less than year fair value (FV) fair value discount % (FVDisc) is positive and green indicating buy. On mouseover or click FV1Disc and FV3Disc display FV and eps.

Growth is the equivalent annual EPS Year1 to Year3 % change, positive is green, negative is red.

Trigger High / Low ,+/-Value (FVY1), +/-Trend,+/-Growth
Technical
- Version
- 2023
- Manifest
- V3
- Size
- 3.32KiB
- Min Chrome
- 88
- Languages
- 1
- Featured
- No
Metadata
- ID
- mgemkahoggpjenmmmdldbfbalfdhbhac
- Developer ID
- u2e496e55f55e8c1cbb259b7caea405a7
- Developer Email
- [email protected]
- Created
- Feb 13, 2013
- Last Updated (Store)
- Jun 20, 2023
- Last Scraped
- May 19, 2026
- Website
- https://bizpep.com/
- Support URL
- https://bizpep.com/sharevalue/?display=help
- Privacy Policy
- —
Similar extensions
Alternatives to Share Value Price Trend, ranked by description similarity.
Short Sales Share Price Trend
Short Sales Share Price Trend applies trend analysis to asx daily reported Gross Short Sales transactions and share close prices.
80
★ 1.0
FairValue — Instant Stock Valuations
Instant valuations for any stock using a DCF. Calculate intrinsic value on Yahoo Finance, Google Finance & 15+ sites.
3
Stock Checkup Flaw Counter
Counts the number of Stock Checkup Flaws at https://research.investors.com/stock-checkup.
493
★ 5.0
Screener DCF Calculator
Save time and calculate DCF easily with data from Screener
34
★ 5.0
Stock Market Forecast
Analyzes stocks using historical data, and presents a probable Forecast for the near future.
24
★ 5.0
UNiFY Screener: Valuations, Growth & TradingView
Adds custom Valuation (Bull/Base/Bear Case), QOQ Growth, and TradingView link to Screener.in for analysis.
35
★ 5.0
Trendtrade
A Trendtrade extension
10
★ 5.0
Diviget
Track upcoming Ex-Dividend dates, live yields, and build a personalized watchlist directly in your browser.
3
★ 5.0
Data sourced from the Chrome Web Store · last verified May 19, 2026.