
Stock Checkup Flaw Counter
Counts the number of Stock Checkup Flaws at https://research.investors.com/stock-checkup.
As of May 2026, Stock Checkup Flaw Counter has 493 users and a 5.00/5 rating from 7 reviews in the Workflow & Planning category.
Usersdown 0.8 percent−0.8%
493
493
Ratingno change0%
5.00
7 reviews
Reviewsno change0%
7
Version
1.30
Manifest V3
History
2 snapshotsTracking since Apr 24, 2026.
View as table
| Date | Users | Rating | Reviews | Version |
|---|---|---|---|---|
| Apr 24, 2026 | 497 | 5.00 | 7 | 1.30 |
| May 21, 2026 | 490 | 5.00 | 7 | 1.30 |
| Now | 493 | 5.00 | 7 | 1.30 |
Permissions & access
- Permissions
- None declared
- Host access
- *://*.investors.com/
Screenshots

About
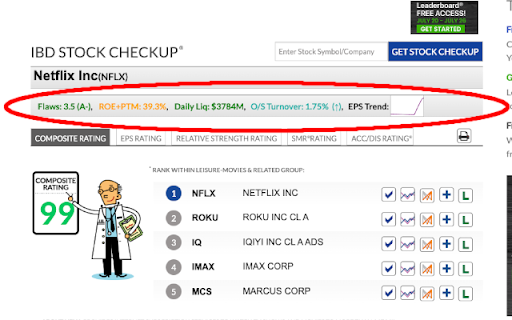
Save time when trying to count Stock Checkup flaws on investors.com.  This extension counts the flaws (according to common IBD Meetup rules) and assigns a letter grade.  Also calculates ROE (return on equity) plus PTM (pre-tax margin), and calculates the average daily liquidity (average daily dollar volume proxy).  Put your calculator and notepad away!

NEW: Calculates share turnover % (50-day Avg Volume / shares available).  On /stock-checkup page, shows turnover of shares outstanding. On /stock-quotes page, also shows turnover of float.  The arrow next to Turnover on the /stock-checkup page shows the Up/Down Volume ratio

Also adds a rudimentary EPS trend chart, so you can see at a glance if earnings may be decelerating.

For more info on these scoring tools, please visit the Petaluma Investor's Business Daily Meetup site: https://sites.google.com/view/petalumaibdmeetup

This tool is for educational purposes only, and not intended to recommend any security.  Use at your own risk!  We are not responsible for errors or omissions.  This is not to be construed as investment advice, and we are not investment advisors.

Browser extension development is supported by user donations.  If you find this extension useful, please consider sending a commensurate donation to support our developers, via this url:  https://www.paypal.com/donate?hosted_button_id=VYB6ZVDTU4KEG


FAQ:
1) "Why is the EPS Trend chart blank for some stocks?"

Good question.  The answer is that some stocks have an "N/A" for either 3Yr EPS, 3Qtr EPS or last EPS. Without 3Y, 3Q, & 1Q, no trend can be drawn.  If the EPS Trend chart is blank, that means not enough data are available to determine a trend.

If you see a very small gap at the righthand end of the chart, that means there is no current estimate.
Technical
- Version
- 1.30
- Manifest
- V3
- Size
- 101KiB
- Min Chrome
- 88
- Languages
- 1
- Featured
- No
Metadata
- ID
- hjjmcblclhoojiebngknemobljbjocdi
- Developer ID
- ud61ef3ca645b62f732e022bf25733b4e
- Developer Email
- [email protected]
- Created
- Sep 25, 2019
- Last Updated (Store)
- Jan 20, 2023
- Last Scraped
- May 21, 2026
- Website
- crystalbull.com
- Support URL
- —
- Privacy Policy
- https://www.crystalbull.com/extension-privacy
Similar extensions
Alternatives to Stock Checkup Flaw Counter, ranked by description similarity.
Ampersand: Financial Research Tool
Financial Research & Education Tool
6
★ 5.0
Stock Analysis Overlay (Simply Wall St)
An AI powered analysis overlay
6.0K
★ 4.1
Empower retail investors
Empowering retail investors by providing the right tools to enable their participation and success in financial markets.
19
★ 5.0
The Optimiser - TradingView Strategies
Optimise TradingView Strategies An assistant for optimising (Optimize) & backtesting trading strategies in Tradingview
5.0K
★ 4.0
AutoChart by USstockRadar
AI-powered technical analysis for TradingView
12
Robinhood Better Reports
Invest better with the Robinhood Better Reports
44
★ 3.7
TrendSpider
An extension that enables TrendSpider users to quickly see a chart whenever they encounter a ticker on a webpage.
2.0K
★ 4.6
finqtool - Crypto Trading Toolkit
Live crypto prices, charts, order book, funding rates, watchlists, alerts & calculators. Private, works offline.
348
★ 5.0
Data sourced from the Chrome Web Store · last verified May 21, 2026.