
Short Sales Share Price Trend
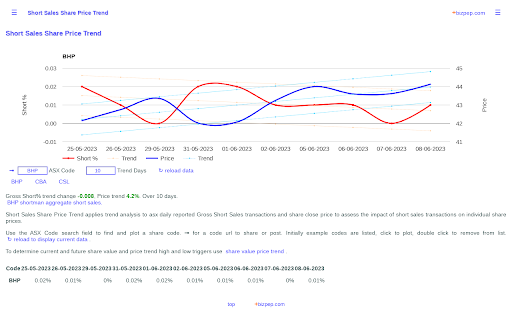
Short Sales Share Price Trend applies trend analysis to asx daily reported Gross Short Sales transactions and share close prices.
As of May 2026, Short Sales Share Price Trend has 80 users and a 1.00/5 rating from 1 reviews.
Usersdown 5.9 percent−5.9%
80
80
Ratingno change0%
1.00
1 reviews
Reviewsno change0%
1
Version
2023
History
2 snapshotsTracking since May 2, 2026.
View as table
| Date | Users | Rating | Reviews | Version |
|---|---|---|---|---|
| May 2, 2026 | 85 | 1.00 | 1 | 2023 |
| May 31, 2026 | 79 | 1.00 | 1 | 2023 |
| Now | 80 | 1.00 | 1 | 2023 |
Permissions & access
- Permissions
- None declared
- Host access
- None declared
Screenshots

About
Short Sales Share Price Trend applies trend analysis to asx daily reported Gross Short Sales transactions and share close price to assess the impact of short sales transactions on individual share prices.

Short % is daily reported Gross Short Sales transactions (number of share short sales) as a percentage of issued capital (number of issued shares). This is not the level of open short positions but it does provide an indication of short sales activity.

The short sales trend has a relationship to market sentiment, share value and price trend. Short sales increase when a share price is perceived to be higher than its price will be sometime in the future ie price high / shorts up. Short sales decrease when a share price is perceived to be approaching its lower future price, ie price low / short sales down. High levels of short sales transactions increase share sell volume resulting in downward price pressure and when these transactions are covered they increase share buy volume resulting in upward price pressure. The result is increased price liquidity and volatility. To determine current and future share value and price trend high and low triggers see share value price trend.

While gross shorts provide no indication of the open shorts for the day they do provide an indication of short interest. Reviewing aggregate and gross short data there is a loose correlation (possibly looser than it should be due to lack of reporting transparency and compliance). Gross short transactions activity can sometimes be inferred from short term price action however what is of value is that the level of gross short activity can provide a leading indicator of sentiment and perceived risk (not always visible in price action) which assists in determining critical price points and improving entry / exit points.

Short sold shares must be covered and the seller must have the right to the shares sold. To cover short sales shares are loaned. The value of loaned shares is an indicator of short sales activity. Share Loan Price Trend plots daily loaned share percentages and share price. This correlates with the Short Sales Share Price Trend

Trend data based on asx daily reported gross short sales, update schedule T+1 11:15 aest. ☰ top left to ↻ reload data and ⚠ reset to clear locally stored data and reset application.
Technical
- Version
- 2023
- Manifest
- —
- Size
- 5.21KiB
- Min Chrome
- 88
- Languages
- 1
- Featured
- No
Metadata
- ID
- bekkeghkgaodpkbgpcpkllhnekibaabg
- Developer ID
- u2e496e55f55e8c1cbb259b7caea405a7
- Developer Email
- [email protected]
- Created
- Oct 2, 2013
- Last Updated (Store)
- Jun 24, 2023
- Last Scraped
- May 31, 2026
- Website
- https://bizpep.com/
- Support URL
- https://bizpep.com/shortsales/?a=cws
- Privacy Policy
- —
Similar extensions
Alternatives to Short Sales Share Price Trend, ranked by description similarity.
Share Value Price Trend
Share Value Price Trend provides unique insight to improve share trading and investment performance.
84
★ 3.0
Trendtrade
A Trendtrade extension
10
★ 5.0
Hot Stocks Today - Real-Time Market Tracker
Track trending stocks in real-time! Get instant updates on top gainers, losers, and most active stocks with live market data.
3
Stock Checkup Flaw Counter
Counts the number of Stock Checkup Flaws at https://research.investors.com/stock-checkup.
493
★ 5.0
Stock Market Forecast
Analyzes stocks using historical data, and presents a probable Forecast for the near future.
24
★ 5.0
Reddit Stock Sentiment Tracker
Analyze stock sentiment from Reddit posts including titles, selftext and top comments
11
★ 5.0
EarlySense - Stock Monitor
Stock volatility alerts with 1Y data analysis, Sharpe ratio tracking, portfolio analysis, and state-aware VSA volume insight
—
Market X-Ray
See institutional data (Max Pain) directly on Twitter/Reddit
3
Data sourced from the Chrome Web Store · last verified May 31, 2026.