
Pivotal Extensions
Make tweaks to Pivotal Tracker's UI to enhance usability.
As of May 2026, Pivotal Extensions has 14 users in the Productivity category.
Usersno change0%
14
14
Ratingno change0%
—
— reviews
Reviewsno change0%
—
Version
0.4.0
Manifest V3
History
2 snapshotsTracking since Apr 25, 2026.
View as table
| Date | Users | Rating | Reviews | Version |
|---|---|---|---|---|
| Apr 25, 2026 | 14 | — | — | 0.4.0 |
| May 22, 2026 | 16 | — | — | 0.4.0 |
| Now | 14 | — | — | 0.4.0 |
Permissions & access
- Permissions
- storageactiveTabwebRequest
- Host access
- https://www.pivotaltracker.com/n/projects/*, https://www.pivotaltracker.com/reports/v2/projects/*
Screenshots

About
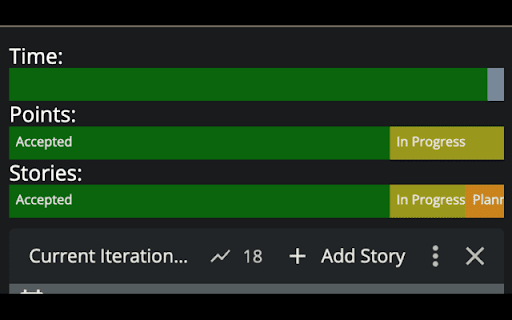
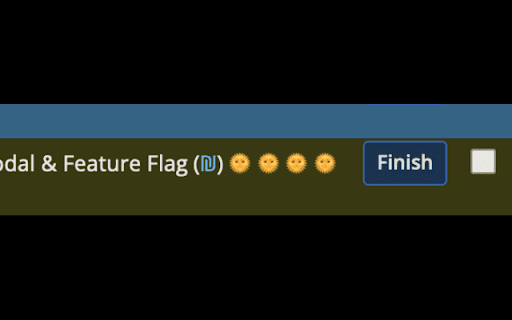
Make tweaks to Pivotal Tracker's project panel UI to give teams some important information at a glance.

Days in Progress - Adds a sun emoji for every day a story has been in progress. This helps to bring visibility to long-running stories that "should be done today" for days at a time.

Iteration Progress - Adds a series of progress bars above the current iteration column header giving a visual indication of how far through the iteration the team is in stories and points compared to the current date.

Cycle Time By Point Detail Chart - Adds a chart on the Analytics -> Cycle Time that gives adds more details to the Cycle Time by Point chart. Specifically, it gives the average time a story with a given estimate spends in total, and in several key states over the given number of iterations.

*Disclaimer:* Points don't equal time, and it's important that the whole team understands why. However, retrospectively it can be advantagous to look for patterns in a team's estimation. It takes a high degree of trust within the team to do this effectively, but the goal of surfacing these metrics is to drive conversations around potential behavior changes that lead to more effective development. The intent is not to pursue any metric for the sake of itself.

Label Statistics Chart - Adds a chart on the Analytics -> Cycle Time page that gives some basic statistics on the labels a user specifies. Specifically, it shows the total hours worked on cards with that label, the number of points associated with those cards (if applicable), and the total number of Feature, Chore, and Bug cards with that label.

https://github.com/patrickelam/pivotal_extensions
Technical
- Version
- 0.4.0
- Manifest
- V3
- Size
- 75.92KiB
- Min Chrome
- 88
- Languages
- 1
- Featured
- No
Metadata
- ID
- bojmgjoegeahmjofoknmjfglncfkhgai
- Developer ID
- u484cabb0a414830cc040684d9102865f
- Developer Email
- [email protected]
- Created
- Feb 1, 2024
- Last Updated (Store)
- May 12, 2024
- Last Scraped
- May 22, 2026
- Website
- —
Similar extensions
Alternatives to Pivotal Extensions, ranked by description similarity.
Piazzanalytics
Provides some analytics visualizations about post activity and waiting times for Piazza classes.
—
Workday Time Entry Visualizer
Detects Workday Time Entry Approval screens and offers a visual graph of time entry data.
9
Ticket360
360-degree view of Jira tickets: status and assignee history, and configurable fields within your browser.
12
Itch Stats
Additional stats for the itch.io dashboard
14
Case Counter Clicker
Track your daily case processing goals as a claim analyst
10
Basecamp: Progress Bars for Cards
Add a progress bar to Basecamp cards based on steps progress
8
Chronotile
Visualize your day in time blocks
4
TimeChimp Billability Chart
Adds a billability chart on the TimeChimp hours page.
12
★ 5.0
Data sourced from the Chrome Web Store · last verified May 22, 2026.