
Tag Manager Server Debug Console
Extension for TMS debug mode
As of May 2026, Tag Manager Server Debug Console has 275 users and a 5.00/5 rating from 1 reviews in the Developer Tools category.
Usersup 0.7 percent+0.7%
275
275
Ratingno change0%
5.00
1 reviews
Reviewsno change0%
1
Version
0.2.0
Manifest V3
History
2 snapshotsTracking since Apr 29, 2026.
View as table
| Date | Users | Rating | Reviews | Version |
|---|---|---|---|---|
| Apr 29, 2026 | 273 | 5.00 | 1 | 0.2.0 |
| May 26, 2026 | 281 | 5.00 | 1 | 0.2.0 |
| Now | 275 | 5.00 | 1 | 0.2.0 |
Permissions & access
- Permissions
- activeTab
- Host access
- <all_urls>
Screenshots


About
This extension only works in combination with the Tag Manager Server (v0.4.0) Tracking setup. It is used to analyze all server requests to and from the TMS.
With the TMS Debug Console you can view all dataLayer Push events and executed server tags.
TMS Debug Console (chrome extension)
1. Download this Chrome extension from chrome web store:
2. Set the debugAuth code in your config.php: $aConfig['default']['debugAuth'] = '...';
3. Navigate to your Page with TMS implementation
4. Open the TMS Debug Console Settings with a click on the extension icon
- Set the same authCode as before
- Activate Debug Console and debugMode if needed
- Test new container from your server
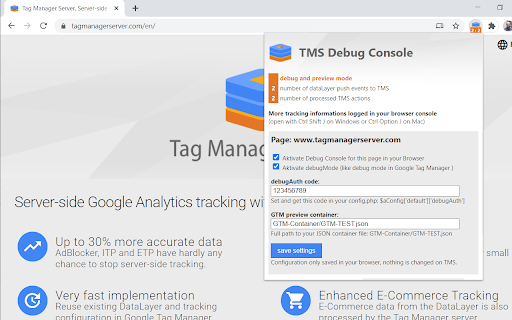
Debug Console settings & information
The coloured background of the numbers shows the status of the current server-side tracking:
- grey: inactive Debug Console
- green: Browser console logs activated
- orange: activated debug mode
- purple: container preview
- red: invalid debugAuth code or TMS error
The two numbers show:
- Tag Manager Server Input shows the submitted data from the browser to the TMS API.
- Tag Manager Server Action shows the server request of the TMS via the measurement protocol to Google Analytics
Browser console output
Once you have activated the Debug Console with the appropriate debugAuth code, the browser console will display the most important tracking information.
Like this extension the whole server-side tracking solution is still in beta stage. You can find more information on our website.Technical
- Version
- 0.2.0
- Manifest
- V3
- Size
- 33.94KiB
- Min Chrome
- 88
- Languages
- 1
- Featured
- No
Metadata
- ID
- camhbggldedhfjbjabcndiggmpfghkdp
- Developer ID
- u712e6e3388ff56d4069af02ec001efec
- Developer Email
- [email protected]
- Created
- Jul 6, 2020
- Last Updated (Store)
- Feb 20, 2025
- Last Scraped
- May 26, 2026
- Website
- tagmanagerserver.com
- Privacy Policy
- —
Similar extensions
Alternatives to Tag Manager Server Debug Console, ranked by description similarity.
Matomo Tag Manager Monitor
Monitor Matomo Tag Manager events, triggers, and tags for debugging purposes
103
Trackingplan
Trackingplan helps you debug your analytics live in your browser.
104
★ 5.0
AH Debugger
Debug analytics and marketing pixels in real time with AH Debugger.
156
★ 5.0
Google Analytics Debugger
Prints useful information to the JavaScript console by enabling the debug version of the Google Analytics Javascript.
600.0K
★ 4.2
Matomo Helper
Extends Matomo and Matomo Tag Manager
1.0K
★ 3.0
Chrome Logger
For server side logging and debugging in chrome console.
30.0K
★ 4.0
DataLayer SidePanel
A professional-grade analytics debugger that visualizes the gap between user actions and tracking events
37
sGTM - add X-Gtm-Server-Preview Header
GA4 & Server-Side Tag Manager debugging helper. This tool helps debug your tracking setup with two key features:
1. It adds the…
298
★ 5.0
Data sourced from the Chrome Web Store · last verified May 26, 2026.