
ChatGPT Chart Previewer Chart Maker
ChatGPT Chart Previewer Chart Maker
As of May 2026, ChatGPT Chart Previewer Chart Maker has 253 users in the Productivity category.
Usersdown 0.8 percent−0.8%
253
253
Ratingno change0%
—
— reviews
Reviewsno change0%
—
Version
2024.09.16
Manifest V3
History
2 snapshotsTracking since Apr 25, 2026.
View as table
| Date | Users | Rating | Reviews | Version |
|---|---|---|---|---|
| Apr 25, 2026 | 255 | — | — | 2024.09.16 |
| May 22, 2026 | 243 | — | — | 2024.09.16 |
| Now | 253 | — | — | 2024.09.16 |
Permissions & access
- Permissions
- identityidentity.emailstorage
- Host access
- None declared
Screenshots

About
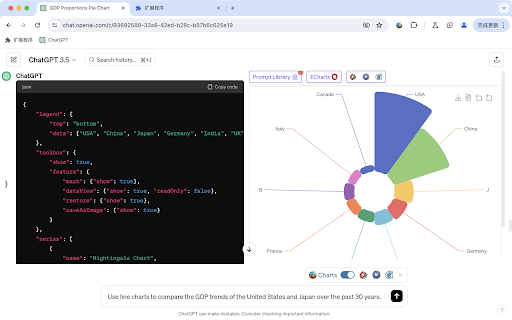
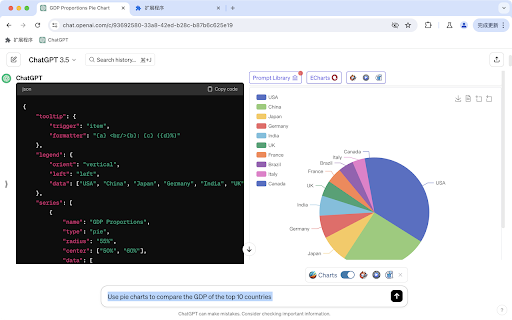
Turn ChatGPT into your chart drawing assistant.

Companion GPTs:
https://chat.openai.com/g/g-T8PdfcCzR-any-chart-maker-line-bar-area-pie-polar-flow

Prompt

```

Use the echarts data format to output JSON data.
Ensure the data is in valid JSON format, and do not include any comments in the JSON.
Do not fabricate data, and do not use any functions.
Use the data I provide, or real data you are aware of, or look up relevant data online.
Each dialogue should output the complete format of the echarts data, do not omit, and do not use ellipsis to replace JSON data previously mentioned.
Output JSON in one codeblock.

Output the GDP proportions of countries around the world, using a pie chart.

```

Features:
- Using your own data, tell ChatGPT your requirements and instantly receive beautiful visualized graphics.

- Alternatively, with ChatGPT's web browsing capability, simply state your request and get the latest visualized data results that you care about.

- Supporting line charts, bar charts, pie charts, scatter plots, and over 100 types of graphics, covering all application scenarios.

- Download the graphics as high-definition images and apply them to PPTs, documents, web pages, and anywhere else.

Usage examples:
- Compare the GDP growth of China, the United States, Japan, South Korea, France, Germany over the last 30 years, and display it as a line chart.

- Show the growth of NASDAQ over the last 30 years in a line chart.

- Visualize the population proportions of major countries worldwide and display them in a pie chart.

- Provide your annual sales data and let ChatGPT transform it into a bar chart display.
Technical
- Version
- 2024.09.16
- Manifest
- V3
- Size
- 920KiB
- Min Chrome
- 88
- Languages
- 1
- Featured
- No
Metadata
- ID
- bogannehcoegblbegkklfdboilgimjaa
- Developer ID
- u95fbeb15a8273768f7935f5e5e5d707c
- Developer Email
- [email protected]
- Created
- Oct 16, 2023
- Last Updated (Store)
- Sep 17, 2024
- Last Scraped
- May 22, 2026
- Website
- windchat.link
- Support URL
- —
- Privacy Policy
- https://windchat.link/privacy
Similar extensions
Alternatives to ChatGPT Chart Previewer Chart Maker, ranked by description similarity.
ChatGPT Diagram & Visual Enhancement
Transform your ChatGPT conversations with powerful diagram and visualization tools.
3
GPT Tracker - Usage Heatmap
Track ChatGPT usage stats with a GitHub-style contribution graph.
15
★ 5.0
ChatGPT Elegant Exporter - Save ChatGPT to PDF, HTML, Markdown, or Text
Export ChatGPT conversations as beautifully styled PDF, HTML, Markdown, or Text files with code highlighting and dark mode support.
211
★ 4.7
ChatGPT Batch Tasks Bulk Work flow Excel
ChatGPT Batch Tasks Bulk Work flow Excel
434
★ 4.5
From Chaos
Turn webpages into organized data.
13
Pie Chart Generator
Use Pie Chart Generator — the ultimate pie chart maker for quick graph visualization.
15
BearGPT - Chatgpt Enhancer
a better experience in chatgpt with table of questions, customize content width and so on
270
★ 4.9
Xplain it
Take a screenshot and get a simple explanation from ChatGPT.
2
★ 5.0
Data sourced from the Chrome Web Store · last verified May 22, 2026.