
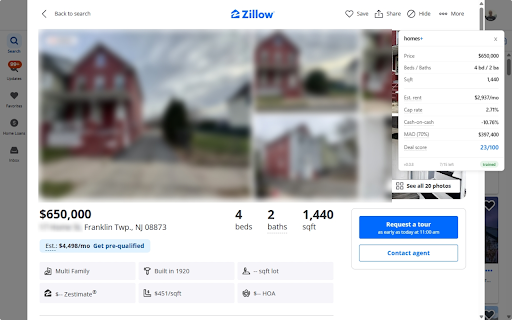
homes.plus — Investor Overlay
Cap rate, cash-on-cash, demand signals, and a deal score on every Zillow listing.
As of June 2026, homes.plus — Investor Overlay has 2 users in the Productivity category.
Usersno change0%
2
2
Ratingno change0%
—
— reviews
Reviewsno change0%
—
Version
0.1.5
Manifest V3
90-day change · In the last 90 days this extension 4 version updates.
History
5 snapshotsTracking since May 12, 2026.
View as table
| Date | Users | Rating | Reviews | Version |
|---|---|---|---|---|
| May 12, 2026 | — | — | — | 0.0.9 |
| May 17, 2026 | — | — | — | 0.0.9 |
| May 24, 2026 | 1 | — | — | 0.0.27 |
| May 31, 2026 | 2 | — | — | 0.0.29 |
| Jun 6, 2026 | 2 | — | — | 0.0.33 |
| Now | 2 | — | — | 0.1.5 |
Changelog
- Jun 6, 2026description
Homes Plus overlays the numbers investors actually need onto every Zillow listing — without ever leaving the page.

Open any property at zillow.com/homedetails/... and a clean side panel appears with:

• Estimated monthly rent (Random Forest model trained on 41,000+ rentals across 48 states, cross-checked against Zillow's own Rent Zestimate when available)
• Cap rate using actual property tax + itemized expenses (insurance, maintenance, vacancy, HOA)
• Cash-on-cash return (25% down, 7.2%, 30-year — customizable in settings)
• 0–100 deal score combining the underwriting math with live demand signals
• Days on market + saves, with a 7-tier demand pill (insane → very hot → hot → healthy → mild → cold → dead)
• Zillow's own "sells faster than X%" hot-home indicator when present
• Annual property tax, HOA, Zestimate delta from list price, recent price cuts
• Save listings to a sortable, filterable list with one-click CSV export

No copy-paste, no spreadsheet, no five tabs open at once. Underwrite a property in the time it takes to scroll past the photos.

WHY THIS EXISTS
Real estate investors evaluate dozens of listings per week. The data is on Zillow; the math is not. Most analysts solve this by exporting addresses to Excel, pulling Rentometer values, and computing metrics by hand. homes.plus does it inline, on every listing page, with no workflow change.

THE RENT MODEL
Rent estimates come from a Random Forest trained on 41,000+ public rental listings across 48 states and 7,600+ ZIP codes. Coverage is strongest where training data is densest; listings in thinly-covered markets are flagged so you know when to double-check. When Zillow shows its own Rent Zestimate on the page, we display it inline alongside ours and cap our prediction tightly against it — so a model overshoot never quietly inflates the deal score on properties Zillow has solid comp data for.

THE CAP RATE
Cap rate is annual net operating income divided by purchase price. Most extensions use the "50% rule" shortcut (operating expenses ≈ 50% of rent), which over-estimates expenses in low-tax states and under-estimates them in high-tax states. We pull the actual property tax from Zillow's public tax history when available and add typical insurance (0.4% of price), maintenance (1%), vacancy (6% of rent), and HOA. A more honest first-pass screen than the 50% rule.

THE DEAL SCORE
A 0–100 composite combining cap rate, cash-on-cash, days on market, save count, Zillow's hot-home percentile, recent price reductions, and Zestimate delta from list. 70+ is strong; 50–70 is decent; under 50 is weak. Sortable across your saved list. Use it as a first-pass filter, not a substitute for due diligence.

CUSTOMIZE THE ASSUMPTIONS
The toolbar popup includes a settings page where you can override the financing defaults — down payment %, interest rate, insurance, maintenance, vacancy, management ratio. The overlay re-renders with your numbers. Useful if you finance differently, target a different rehab buffer, or want to stress-test a deal at higher rates.

SAVE + EXPORT
One-click save on any listing. The saved page shows your full pipeline as a sortable table with color-coded deal scores, filters by state / zip / score range, and a CSV export for spreadsheet work or sharing with partners. Metrics are snapshotted at save time so your list doesn't silently re-rate as prices change.

PRIVACY
The extension only runs on Zillow listing pages. It reads the publicly displayed price, beds, baths, sqft, address, and additional listing facts from the page, and sends them to api.homes.plus to compute the metrics. Optional Google sign-in unlocks weekly bonus credits. No account is required for the free tier. We log coarse, anonymous usage events (e.g. "an analyze happened in zip 07036, cap rate bucket 5–7%") so we can fix bugs and improve the rent model — never raw listing data or anything that identifies a user. Full policy: https://homes.plus/privacy.html

ROADMAP
v0 ships on Zillow only. Redfin and Realtor.com support, server-synced saved properties across devices, and Google Sheets export are on the roadmap. Vote at [email protected].

Made by eCuras LLC. Questions? [email protected]
```
Homes Plus overlays the numbers investors actually need onto every Zillow listing, without ever leaving the page.

Open any property at zillow.com/homedetails/... and a clean side panel appears with:

• Estimated monthly rent, with a strategy switcher for long-term, short-term (Airbnb), or mid-term (30+ day) rental
• Cap rate using actual property tax and itemized expenses (insurance, maintenance, vacancy, HOA)
• Cash-on-cash return (25% down, 7.2%, 30-year, customizable in settings)
• 0-100 deal score combining the underwriting math with live demand signals
• "Why this score" breakdown that itemizes every factor moving the score up or down
• Red, yellow, and green flag detection: negative cash flow, carrying costs above 30% of rent, high property tax, thin rent-to-price, priced above Zestimate, motivated-seller signals
• STR-regulation badge per city when you're in short-term-rental mode (allowed, restricted, banned) with a link to the official ordinance
• Days on market and saves, with a 7-tier demand pill (insane to dead)
• Zillow's own "sells faster than X%" hot-home indicator when present
• Annual property tax, HOA, Zestimate delta from list price, recent price cuts
• One-click save to a sortable, filterable list with CSV export
• Side-by-side comparison of any 2 to 4 saved properties, with the winner highlighted on every metric
• Save-as-PDF one-page investor report you can file, print, or share with partners

No copy-paste, no spreadsheet, no five tabs open at once. Underwrite a property in the time it takes to scroll past the photos.

WHY THIS EXISTS

Real estate investors evaluate dozens of listings per week. The data is on Zillow; the math is not. Most analysts solve this by exporting addresses to Excel, pulling Rentometer values, and computing metrics by hand. homes.plus does it inline on every listing page, with no workflow change.

THE RENT MODEL

Rent estimates come from a model trained on tens of thousands of public rental listings across the United States. When Zillow shows its own Rent Zestimate on the page, we display it inline alongside ours and cap our prediction tightly against it, so a model overshoot never quietly inflates the deal score on properties Zillow has solid comp data for. Markets where our training data is thin are flagged so you know when to double-check the number.

THE CAP RATE

Cap rate is annual net operating income divided by purchase price. Most extensions use the "50% rule" shortcut (operating expenses about 50% of rent), which over-estimates expenses in low-tax states and under-estimates them in high-tax states. We pull the actual property tax from Zillow's public tax history when available and add typical insurance (0.4% of price), maintenance (1%), vacancy (6% of rent), and HOA. A more honest first-pass screen than the 50% rule.

THE DEAL SCORE

A 0-100 composite combining cap rate, cash-on-cash, days on market, save count, Zillow's hot-home percentile, recent price reductions, and Zestimate delta from list. 70 and above is strong; 50 to 70 is decent; under 50 is weak. Sortable across your saved list. Use it as a first-pass filter, not a substitute for due diligence. Click "why" inside the deal score to see every factor that moved it.

STRATEGY SWITCHER (LTR, STR, MTR)

Toggle between long-term rental, short-term rental (Airbnb), and mid-term rental (30+ day) in the overlay. Cap rate, cash flow, and the deal score recompute against per-strategy multipliers and expense ratios you can configure in settings.

When you switch to short-term, homes.plus also surfaces a regulation badge for the city. A curated database of major US markets with status (allowed, restricted, banned) and a direct link to the official municipal ordinance, so you do not underwrite STR cash flow in a city that does not permit it.

RED AND GREEN FLAGS

Right under the metrics, the overlay surfaces severity-coded callouts: negative cash flow, carrying costs above 30% of rent, high property tax, thin rent-to-price, priced above Zestimate, stale listing, insurance-risk state, and on the positive side, strong cash-flow yield, motivated-seller price cuts, and listings priced well below Zestimate. Each flag explains itself on hover.

CUSTOMIZE THE ASSUMPTIONS

The toolbar popup includes a settings page where you can override the financing defaults: down payment, interest rate, insurance, maintenance, vacancy, management ratio, plus the STR and MTR rent multipliers and expense ratios. The overlay re-renders with your numbers. Useful if you finance differently, target a different rehab buffer, or want to stress-test a deal at higher rates.

SAVE, COMPARE, EXPORT

One-click save on any listing. The saved page shows your full pipeline as a sortable table with color-coded deal scores, filters by state, ZIP, or score range, and a CSV export for spreadsheet work or sharing with partners. Pick any 2 to 4 of your saved deals and open the side-by-side comparison view, which highlights the winner per metric across price, returns, costs, and listing signals. Generate a one-page PDF investor report on any analyzed listing for filing, printing, or sharing with a partner. Metrics are snapshotted at save time so your list doesn't silently re-rate as prices change.

PRIVACY

The extension only runs on Zillow listing pages. It reads the publicly displayed price, beds, baths, sqft, address, and additional listing facts from the page, and sends them to api.homes.plus to compute the metrics. Optional Google sign-in lets you claim weekly bonus credits. No account is required for the free tier. We log coarse, anonymous usage events (for example, "an analyze happened in zip 07036, cap rate bucket 5 to 7%") so we can fix bugs and improve the rent model. Never raw listing data or anything that identifies a user. Full policy: https://homes.plus/privacy.html

ROADMAP

v0 ships on Zillow only. Redfin and Realtor.com support, server-synced saved properties across devices, and Google Sheets export are on the roadmap. Feature requests welcome at [email protected].

Made by eCuras LLC. Questions? [email protected]
- May 24, 2026description
```
Homes Plus overlays the numbers investors actually need onto every Zillow listing — without ever leaving the page.

Open any property at zillow.com/homedetails/... and a clean side panel appears with:

• Estimated monthly rent (Random Forest model trained on 41,000+ rentals across 48 states, cross-checked against Zillow's own Rent Zestimate when available)
• Cap rate using actual property tax + itemized expenses (insurance, maintenance, vacancy, HOA)
• Cash-on-cash return (25% down, 7.2%, 30-year — customizable in settings)
• 0–100 deal score combining the underwriting math with live demand signals
• Days on market + saves, with a 7-tier demand pill (insane → very hot → hot → healthy → mild → cold → dead)
• Zillow's own "sells faster than X%" hot-home indicator when present
• Annual property tax, HOA, Zestimate delta from list price, recent price cuts
• Save listings to a sortable, filterable list with one-click CSV export

No copy-paste, no spreadsheet, no five tabs open at once. Underwrite a property in the time it takes to scroll past the photos.

WHY THIS EXISTS
Real estate investors evaluate dozens of listings per week. The data is on Zillow; the math is not. Most analysts solve this by exporting addresses to Excel, pulling Rentometer values, and computing metrics by hand. homes.plus does it inline, on every listing page, with no workflow change.

THE RENT MODEL
Rent estimates come from a Random Forest trained on 41,000+ public rental listings across 48 states and 7,600+ ZIP codes. Coverage is strongest where training data is densest; listings in thinly-covered markets are flagged so you know when to double-check. When Zillow shows its own Rent Zestimate on the page, we display it inline alongside ours and cap our prediction tightly against it — so a model overshoot never quietly inflates the deal score on properties Zillow has solid comp data for.

THE CAP RATE
Cap rate is annual net operating income divided by purchase price. Most extensions use the "50% rule" shortcut (operating expenses ≈ 50% of rent), which over-estimates expenses in low-tax states and under-estimates them in high-tax states. We pull the actual property tax from Zillow's public tax history when available and add typical insurance (0.4% of price), maintenance (1%), vacancy (6% of rent), and HOA. A more honest first-pass screen than the 50% rule.

THE DEAL SCORE
A 0–100 composite combining cap rate, cash-on-cash, days on market, save count, Zillow's hot-home percentile, recent price reductions, and Zestimate delta from list. 70+ is strong; 50–70 is decent; under 50 is weak. Sortable across your saved list. Use it as a first-pass filter, not a substitute for due diligence.

CUSTOMIZE THE ASSUMPTIONS
The toolbar popup includes a settings page where you can override the financing defaults — down payment %, interest rate, insurance, maintenance, vacancy, management ratio. The overlay re-renders with your numbers. Useful if you finance differently, target a different rehab buffer, or want to stress-test a deal at higher rates.

SAVE + EXPORT
One-click save on any listing. The saved page shows your full pipeline as a sortable table with color-coded deal scores, filters by state / zip / score range, and a CSV export for spreadsheet work or sharing with partners. Metrics are snapshotted at save time so your list doesn't silently re-rate as prices change.

PRIVACY
The extension only runs on Zillow listing pages. It reads the publicly displayed price, beds, baths, sqft, address, and additional listing facts from the page, and sends them to api.homes.plus to compute the metrics. Optional Google sign-in unlocks weekly bonus credits. No account is required for the free tier. We log coarse, anonymous usage events (e.g. "an analyze happened in zip 07036, cap rate bucket 5–7%") so we can fix bugs and improve the rent model — never raw listing data or anything that identifies a user. Full policy: https://homes.plus/privacy.html

ROADMAP
v0 ships on Zillow only. Redfin and Realtor.com support, server-synced saved properties across devices, and Google Sheets export are on the roadmap. Vote at [email protected].

Made by eCuras LLC. Questions? [email protected]
```
- May 17, 2026description
homes.plus overlays the numbers investors actually need onto every Zillow listing — without ever leaving the page.

Open any property at zillow.com/homedetails/... and a clean side panel appears with:

• Estimated monthly rent
• Cap rate
• Cash-on-cash return
• MAO (Max Allowable Offer, 70% rule)
• A 0–100 deal score

No copy-paste, no spreadsheet, no five tabs open at once. Underwrite a property in the time it takes to scroll past the photos.

WHY THIS EXISTS
Real estate investors evaluate dozens of listings per week. The data is on Zillow; the math is not. Most analysts solve this by exporting addresses to Excel, pulling rentometer values, and computing metrics by hand. homes.plus does it inline.

THE RENT MODEL
Our rent estimate is generated by a Random Forest model trained on tens of thousands of public rental listings, with stronger coverage in New Jersey and New York. In other markets, the overlay falls back to national averages and clearly labels the coverage level so you know when to trust a number and when to double-check.

WHAT THE METRICS ASSUME
• Cap rate uses the 50% rule (operating expenses ≈ 50% of rent), a standard investor convention
• Cash-on-cash assumes 25% down at 7.2% interest, 30-year amortization
• MAO uses the 70% rule with a rehab estimate capped at 30% of price
• Deal score combines cap rate and cash-on-cash into a single sortable number

These are conventions, not financial advice. Use them as a first-pass filter, not a substitute for due diligence.

PRIVACY
The extension only runs on Zillow listing pages. It reads the publicly displayed price, beds, baths, sqft, and address from the page and sends them to api.homes.plus to compute the metrics. No account, no login, no tracking, no analytics. Full policy: https://homes.plus/privacy.html

ROADMAP
v0 ships on Zillow only. Redfin and Realtor.com support is on the roadmap. Vote at [email protected].

Made by eCuras LLC. Questions? [email protected]
```
Homes Plus overlays the numbers investors actually need onto every Zillow listing — without ever leaving the page.

Open any property at zillow.com/homedetails/... and a clean side panel appears with:

• Estimated monthly rent (Random Forest model trained on 41,000+ rentals across 48 states, cross-checked against Zillow's own Rent Zestimate when available)
• Cap rate using actual property tax + itemized expenses (insurance, maintenance, vacancy, HOA)
• Cash-on-cash return (25% down, 7.2%, 30-year — customizable in settings)
• 0–100 deal score combining the underwriting math with live demand signals
• Days on market + saves, with a 7-tier demand pill (insane → very hot → hot → healthy → mild → cold → dead)
• Zillow's own "sells faster than X%" hot-home indicator when present
• Annual property tax, HOA, Zestimate delta from list price, recent price cuts
• Save listings to a sortable, filterable list with one-click CSV export

No copy-paste, no spreadsheet, no five tabs open at once. Underwrite a property in the time it takes to scroll past the photos.

WHY THIS EXISTS
Real estate investors evaluate dozens of listings per week. The data is on Zillow; the math is not. Most analysts solve this by exporting addresses to Excel, pulling Rentometer values, and computing metrics by hand. homes.plus does it inline, on every listing page, with no workflow change.

THE RENT MODEL
Rent estimates come from a Random Forest trained on 41,000+ public rental listings across 48 states and 7,600+ ZIP codes. Coverage is strongest where training data is densest; listings in thinly-covered markets are flagged so you know when to double-check. When Zillow shows its own Rent Zestimate on the page, we display it inline alongside ours and cap our prediction tightly against it — so a model overshoot never quietly inflates the deal score on properties Zillow has solid comp data for.

THE CAP RATE
Cap rate is annual net operating income divided by purchase price. Most extensions use the "50% rule" shortcut (operating expenses ≈ 50% of rent), which over-estimates expenses in low-tax states and under-estimates them in high-tax states. We pull the actual property tax from Zillow's public tax history when available and add typical insurance (0.4% of price), maintenance (1%), vacancy (6% of rent), and HOA. A more honest first-pass screen than the 50% rule.

THE DEAL SCORE
A 0–100 composite combining cap rate, cash-on-cash, days on market, save count, Zillow's hot-home percentile, recent price reductions, and Zestimate delta from list. 70+ is strong; 50–70 is decent; under 50 is weak. Sortable across your saved list. Use it as a first-pass filter, not a substitute for due diligence.

CUSTOMIZE THE ASSUMPTIONS
The toolbar popup includes a settings page where you can override the financing defaults — down payment %, interest rate, insurance, maintenance, vacancy, management ratio. The overlay re-renders with your numbers. Useful if you finance differently, target a different rehab buffer, or want to stress-test a deal at higher rates.

SAVE + EXPORT
One-click save on any listing. The saved page shows your full pipeline as a sortable table with color-coded deal scores, filters by state / zip / score range, and a CSV export for spreadsheet work or sharing with partners. Metrics are snapshotted at save time so your list doesn't silently re-rate as prices change.

PRIVACY
The extension only runs on Zillow listing pages. It reads the publicly displayed price, beds, baths, sqft, address, and additional listing facts from the page, and sends them to api.homes.plus to compute the metrics. Optional Google sign-in unlocks weekly bonus credits. No account is required for the free tier. We log coarse, anonymous usage events (e.g. "an analyze happened in zip 07036, cap rate bucket 5–7%") so we can fix bugs and improve the rent model — never raw listing data or anything that identifies a user. Full policy: https://homes.plus/privacy.html

ROADMAP
v0 ships on Zillow only. Redfin and Realtor.com support, server-synced saved properties across devices, and Google Sheets export are on the roadmap. Vote at [email protected].

Made by eCuras LLC. Questions? [email protected]
```
- May 17, 2026short_description
Cap rate, cash-on-cash, MAO, and a deal score on every Zillow listing.
Cap rate, cash-on-cash, demand signals, and a deal score on every Zillow listing.
Permissions & access
- Permissions
- storageidentity
- Host access
- https://www.zillow.com/*, https://api.homes.plus/*
Screenshots


About
Homes Plus overlays the numbers investors actually need onto every Zillow listing, without ever leaving the page.

Open any property at zillow.com/homedetails/... and a clean side panel appears with:

• Estimated monthly rent, with a strategy switcher for long-term, short-term (Airbnb), or mid-term (30+ day) rental
• Cap rate using actual property tax and itemized expenses (insurance, maintenance, vacancy, HOA)
• Cash-on-cash return (25% down, 7.2%, 30-year, customizable in settings)
• 0-100 deal score combining the underwriting math with live demand signals
• "Why this score" breakdown that itemizes every factor moving the score up or down
• Red, yellow, and green flag detection: negative cash flow, carrying costs above 30% of rent, high property tax, thin rent-to-price, priced above Zestimate, motivated-seller signals
• STR-regulation badge per city when you're in short-term-rental mode (allowed, restricted, banned) with a link to the official ordinance
• Days on market and saves, with a 7-tier demand pill (insane to dead)
• Zillow's own "sells faster than X%" hot-home indicator when present
• Annual property tax, HOA, Zestimate delta from list price, recent price cuts
• One-click save to a sortable, filterable list with CSV export
• Side-by-side comparison of any 2 to 4 saved properties, with the winner highlighted on every metric
• Save-as-PDF one-page investor report you can file, print, or share with partners

No copy-paste, no spreadsheet, no five tabs open at once. Underwrite a property in the time it takes to scroll past the photos.

WHY THIS EXISTS

Real estate investors evaluate dozens of listings per week. The data is on Zillow; the math is not. Most analysts solve this by exporting addresses to Excel, pulling Rentometer values, and computing metrics by hand. homes.plus does it inline on every listing page, with no workflow change.

THE RENT MODEL

Rent estimates come from a model trained on tens of thousands of public rental listings across the United States. When Zillow shows its own Rent Zestimate on the page, we display it inline alongside ours and cap our prediction tightly against it, so a model overshoot never quietly inflates the deal score on properties Zillow has solid comp data for. Markets where our training data is thin are flagged so you know when to double-check the number.

THE CAP RATE

Cap rate is annual net operating income divided by purchase price. Most extensions use the "50% rule" shortcut (operating expenses about 50% of rent), which over-estimates expenses in low-tax states and under-estimates them in high-tax states. We pull the actual property tax from Zillow's public tax history when available and add typical insurance (0.4% of price), maintenance (1%), vacancy (6% of rent), and HOA. A more honest first-pass screen than the 50% rule.

THE DEAL SCORE

A 0-100 composite combining cap rate, cash-on-cash, days on market, save count, Zillow's hot-home percentile, recent price reductions, and Zestimate delta from list. 70 and above is strong; 50 to 70 is decent; under 50 is weak. Sortable across your saved list. Use it as a first-pass filter, not a substitute for due diligence. Click "why" inside the deal score to see every factor that moved it.

STRATEGY SWITCHER (LTR, STR, MTR)

Toggle between long-term rental, short-term rental (Airbnb), and mid-term rental (30+ day) in the overlay. Cap rate, cash flow, and the deal score recompute against per-strategy multipliers and expense ratios you can configure in settings.

When you switch to short-term, homes.plus also surfaces a regulation badge for the city. A curated database of major US markets with status (allowed, restricted, banned) and a direct link to the official municipal ordinance, so you do not underwrite STR cash flow in a city that does not permit it.

RED AND GREEN FLAGS

Right under the metrics, the overlay surfaces severity-coded callouts: negative cash flow, carrying costs above 30% of rent, high property tax, thin rent-to-price, priced above Zestimate, stale listing, insurance-risk state, and on the positive side, strong cash-flow yield, motivated-seller price cuts, and listings priced well below Zestimate. Each flag explains itself on hover.

CUSTOMIZE THE ASSUMPTIONS

The toolbar popup includes a settings page where you can override the financing defaults: down payment, interest rate, insurance, maintenance, vacancy, management ratio, plus the STR and MTR rent multipliers and expense ratios. The overlay re-renders with your numbers. Useful if you finance differently, target a different rehab buffer, or want to stress-test a deal at higher rates.

SAVE, COMPARE, EXPORT

One-click save on any listing. The saved page shows your full pipeline as a sortable table with color-coded deal scores, filters by state, ZIP, or score range, and a CSV export for spreadsheet work or sharing with partners. Pick any 2 to 4 of your saved deals and open the side-by-side comparison view, which highlights the winner per metric across price, returns, costs, and listing signals. Generate a one-page PDF investor report on any analyzed listing for filing, printing, or sharing with a partner. Metrics are snapshotted at save time so your list doesn't silently re-rate as prices change.

PRIVACY

The extension only runs on Zillow listing pages. It reads the publicly displayed price, beds, baths, sqft, address, and additional listing facts from the page, and sends them to api.homes.plus to compute the metrics. Optional Google sign-in lets you claim weekly bonus credits. No account is required for the free tier. We log coarse, anonymous usage events (for example, "an analyze happened in zip 07036, cap rate bucket 5 to 7%") so we can fix bugs and improve the rent model. Never raw listing data or anything that identifies a user. Full policy: https://homes.plus/privacy.html

ROADMAP

v0 ships on Zillow only. Redfin and Realtor.com support, server-synced saved properties across devices, and Google Sheets export are on the roadmap. Feature requests welcome at [email protected].

Made by eCuras LLC. Questions? [email protected]
Technical
- Version
- 0.1.5
- Manifest
- V3
- Size
- 78.86KiB
- Min Chrome
- 88
- Languages
- 1
- Featured
- No
Metadata
- ID
- ohimgedgfajhdaghfappeelfbombmeki
- Developer ID
- u4c437828ded9f9ffee80a1d09b8428a2
- Developer Email
- [email protected]
- Created
- May 11, 2026
- Last Updated (Store)
- Jun 5, 2026
- Last Scraped
- Jun 6, 2026
- Website
- —
- Support URL
- —
- Privacy Policy
- http://homes.plus/privacy
Data sourced from the Chrome Web Store · last verified Jun 6, 2026.