
Core Web Vitals Live
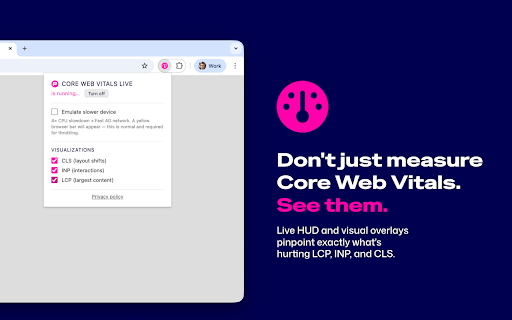
See your website's performance. Live. Real-time LCP, INP, and CLS metrics with visual overlays.
As of June 2026, Core Web Vitals Live has 105 users in the Developer Tools category.
Usersup 950.0 percent+950.0%
105
105
Ratingno change0%
—
— reviews
Reviewsno change0%
—
Version
1.0.0
Manifest V3
History
10 snapshotsTracking since Apr 1, 2026.
View as table
| Date | Users | Rating | Reviews | Version |
|---|---|---|---|---|
| Apr 1, 2026 | 10 | — | — | 1.0.0 |
| Apr 17, 2026 | 10 | — | — | 1.0.0 |
| Apr 22, 2026 | 76 | — | — | 1.0.0 |
| Apr 27, 2026 | 77 | — | — | 1.0.0 |
| May 4, 2026 | 78 | — | — | 1.0.0 |
| May 10, 2026 | 91 | — | — | 1.0.0 |
| May 15, 2026 | 96 | — | — | 1.0.0 |
| May 28, 2026 | 101 | — | — | 1.0.0 |
| Jun 4, 2026 | 98 | — | — | 1.0.0 |
| Jun 10, 2026 | 102 | — | — | 1.0.0 |
| Now | 105 | — | — | 1.0.0 |
Permissions & access
- Permissions
- tabsstorageactiveTabdebugger
- Host access
- None declared
Screenshots


About
Other tools give you numbers. Core Web Vitals Live shows you the problem.

A game-style HUD displays LCP, INP, and CLS as color-coded life bars right on the page — green, amber, or red at a glance. But the real power is in the visual overlays: see the exact element causing your Largest Contentful Paint, watch layout shifts highlighted in real time as they happen, and spot slow interactions with duration badges that appear right where you clicked. No more guessing which element is the culprit — it's highlighted on screen.

Built on Google's official web-vitals library with the same thresholds used by PageSpeed Insights and Search Console. Zero data collection, zero external requests — everything runs locally in your browser.

FEATURES

Live HUD overlay
LCP, INP, and CLS displayed as color-coded life bars in a corner of your page. Green → amber → red tells you instantly if something's wrong. Minimizable and repositionable.

See your LCP element
A pulsing blue border and label highlight the exact element responsible for your Largest Contentful Paint. No more digging through DevTools — it's right there on the page.

Watch layout shifts happen
Every CLS event is visualized as a purple overlay on the shifted element with its score (e.g. "CLS +0.03"). You'll finally understand where your layout instability comes from.

Spot slow interactions instantly
After every click or tap, an INP badge appears near your cursor: amber for 50–200 ms, red for >200 ms. You'll know immediately which interaction is dragging your score down.

Toolbar badge
The extension icon turns green, amber, or red and shows your worst metric value — performance status visible without even opening anything.

Device throttling
Simulate slow CPU and network conditions to test how your site performs for users on low-end devices.

Privacy-first
No data leaves your browser. No accounts, no tracking, no external API calls. Your browsing stays yours.

Aligned with Google's tools
Uses the official web-vitals library — the same measurement logic and thresholds as PageSpeed Insights, Search Console, and CrUX.
Technical
- Version
- 1.0.0
- Manifest
- V3
- Size
- 95.22KiB
- Min Chrome
- 88
- Languages
- 1
- Featured
- No
Metadata
- ID
- ndccadkmooliilcoipkbggfbjhaapcme
- Developer ID
- u261b219371f9ec908b08bc6c22c102f5
- Developer Email
- [email protected]
- Created
- Mar 25, 2026
- Last Updated (Store)
- Apr 29, 2026
- Last Scraped
- Jun 10, 2026
- Website
- pagespeed.one
Data sourced from the Chrome Web Store · last verified Jun 10, 2026.