
Web 性能分析
展示 Web 常见关键性能指标,页面加载瀑布流和资源数据分析等。
As of May 2026, Web 性能分析 has 608 users and a 5.00/5 rating from 3 reviews in the Developer Tools category.
Usersup 3.2 percent+3.2%
608
608
Ratingno change0%
5.00
3 reviews
Reviewsno change0%
3
Version
1.1
Manifest V3
History
2 snapshotsTracking since Apr 24, 2026.
View as table
| Date | Users | Rating | Reviews | Version |
|---|---|---|---|---|
| Apr 24, 2026 | 589 | 5.00 | 3 | 1.1 |
| May 19, 2026 | 607 | 5.00 | 3 | 1.1 |
| Now | 608 | 5.00 | 3 | 1.1 |
Permissions & access
- Permissions
- contextMenus
- Host access
- None declared
Screenshots


About
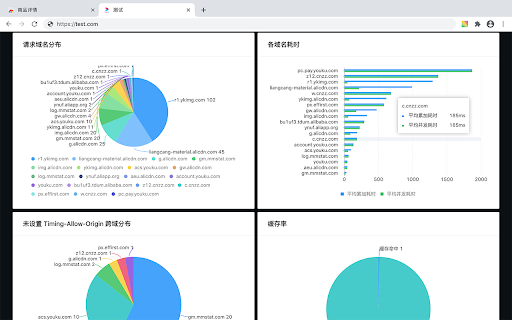
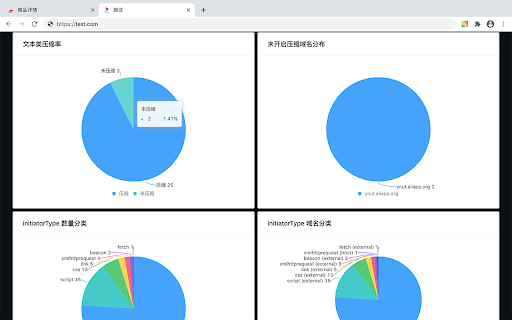
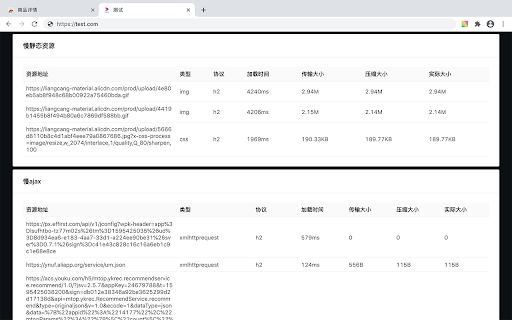
# 性能分析

使用 Performance API 处理数据可视化,本地使用本地展示,不会远程收集用户任何数据,展示数据也不会对当前网页造成任何破坏。

- 关键性能指标。忽略页面卸载时间、重定向时间。
1. 首包:`responseStart - domainLookupStart`
2. 首次渲染/白屏:`responseEnd - fetchStart`
3. 首次可交互:`domInteractive - fetchStart`
4. DOM Ready:`domContentLoadedEventEnd - fetchStart`
5. 页面加载:`loadEventStart - fetchStart`

- 各阶段指标瀑布流
1. unLoad:`unloadEventEnd - unloadEventStart`
2. Redirect:`redirectEnd - redirectStart`
3. AppCache:`domainLookupStart - fetchStart`
4. DNS:`domainLookupEnd - domainLookupStart`
5. TCP:`connectEnd - connectStart`
6. TTFB:`responseStart - requestStart`
7. 数据传输:`responseEnd - responseStart`
8. DOM:`domContentLoadedEventStart - responseEnd`
9. DCL:`domContentLoadedEventEnd - domContentLoadedEventStart`
10. 资源加载:`loadEventStart - domContentLoadedEventEnd`
11. onLoad:`loadEventEnd - loadEventStart`

- 资源分析
1. 首页资源请求数量、加载大小和域名分布情况。
2. 请求资源域名分布,与各个域名平均耗时。
3. 未设置响应头域名分布情况。
4. http 压缩情况,未压缩分布,缓存命中率。
5. 资源类型情况。
6. 显示资源加载和 ajax 请求耗时。
Technical
- Version
- 1.1
- Manifest
- V3
- Size
- 422KiB
- Min Chrome
- 88
- Languages
- 1
- Featured
- No
Metadata
- ID
- mhpaedeeneljbnmhmofceiollddmfjcd
- Developer ID
- u519f763abdcff7bead624dc8610184d5
- Developer Email
- [email protected]
- Created
- Jul 27, 2020
- Last Updated (Store)
- Feb 14, 2025
- Last Scraped
- May 19, 2026
- Website
- —
- Privacy Policy
- https://github.com/Godiswill/web-performance-extension
Similar extensions
Alternatives to Web 性能分析, ranked by description similarity.
网络监测器
实时监测网络请求时长,支持按资源类型筛选
7
Page Consumption Analyzer
Comprehensive page analysis: Performance, Security, SEO, UI, Programming, Storage & Cache metrics in real-time.
9
★ 5.0
Page Load Timing Analyzer
Page load timing analyzer with waterfall charts, compare pages & view detailed performance metrics for better optimization.
97
APMini
TTFB, DOM Ready, Load 지표를 측정하고 오버레이로 표시합니다.
2
Page Load Timer
Measure page load performance
60
AEM 热力分析插件
AEM 热力分析插件
1.0K
★ 5.0
FrontPartner
Analyze front-end performance: console, network, critical CSS, images, and loops in real-time.
3
★ 5.0
FRAMEWORK FOR DEPLOYING WEB TRUSTABILITY
page load time, response time, availability
9
★ 5.0
Data sourced from the Chrome Web Store · last verified May 19, 2026.