
Core Web Vitals Visualizer
Measure, visualize, and debug Core Web Vitals in real time. CrUX history, LCP/CLS/INP breakdowns and performance experiments
As of June 2026, Core Web Vitals Visualizer has 10,000 users and a 4.94/5 rating from 18 reviews in the Developer Tools category.
Usersno change0%
10.0K
10,000
Ratingno change0%
4.94
18 reviews
Reviewsno change0%
18
Version
1.20
Manifest V3
History
1 snapshotsTracking since Apr 16, 2026.
View as table
| Date | Users | Rating | Reviews | Version |
|---|---|---|---|---|
| Apr 16, 2026 | 10.0K | 4.94 | 18 | 1.20 |
| Now | 10.0K | 4.94 | 18 | 1.20 |
Permissions & access
- Permissions
- debugger
- Host access
- None declared
Screenshots


About
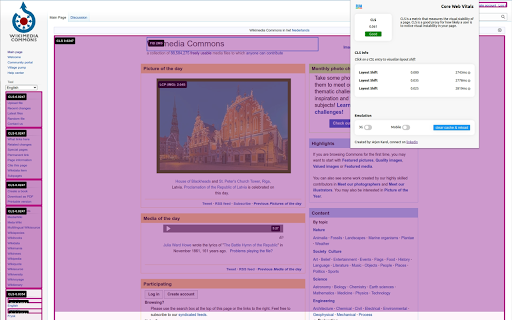
Core Web Vitals Visualizer
Open the popup on any page. See your LCP, CLS, INP, FCP, and TTFB scores instantly, color-coded, live. No separate tool. No copy-pasting URLs into PageSpeed Insights.

What it shows
Real-time scores powered by the web-vitals library, the same library Chrome uses internally. Green means good. Orange means work to do. Red means it's hurting you.

LCP - Green overlay marks the LCP element on the page. Full timing breakdown: TTFB, Resource Load Delay, Resource Load Duration, Element Render Delay. For images: preload status, fetchpriority, 1st vs 3rd party origin, natural vs rendered dimensions, estimated preload savings.

CLS - Pink overlays mark every layout shift source. Click any shift to see an animated before/after replay. Attribution shows the largest shift target and score.

INP - Broken down into Input Delay, Processing Duration, and Presentation Delay. Shows interaction type, target element, and page load state at time of interaction.

FCP and TTFB - -FCP splits into Time to First Byte vs First Byte to FCP. TTFB splits into Cache, DNS, Connection, Request, and Waiting.

CrUX history
25 weeks of Chrome User Experience Report data for any site or URL. Toggle between P75 scores and good/needs-improvement/poor distributions. Switch between mobile and desktop. Trend lines show whether each metric is moving in the right direction.

Render-blocking resources
Every render-blocking stylesheet and script listed with individual file timings and total blocking duration.

Performance experiments
Test fixes without touching your code. Disable JS, defer all JS, or block third-party JS. Lazy load images, de-prioritize background images, disable web fonts or third-party CSS. Run any experiment with cache cleared to measure real cold-load impact.

Network throttling
Simulate slow 3G with CPU throttling. Clear cache and reload to measure cold performance.
Built for developers

Minimal permissions. No data collection. Everything runs locally. All vitals logged to the console for debugging.

One-click links to CrUX Dashboard, PageSpeed Insights, and the W3C HTML Validator for the current page.

changes:
1.19 New Signal scan and minor fixes
1.18 Fixed INP attribution logic
1.17 Redesign of Experiments and new Audit tab, Minor logic an UI fixes
1.16 Added content audit, refactored experiments and minor layout improvements
1.15 Minor fixes
1.14 Added Treo.sh link, removed depricated looker studio report, added crux lcp subparts, rtt. navigation types and lcp types
1.13 Added CrUX Vis link, better fallback for missing CrUX data and small bigfixes.
1.12 Better messaging + improved elementtiming, better logging to console
1.11 Removed the FID, the Web Vitals are now based upon the upcoming v4 of the web vitals library, new breakdown details, improved CSS visualization, small bugfixes, code cleanup.
1.10 Promote INP to a Core Web Vitals and demote FID to a metric of interest!
1.9 CrUX history API, small fixes, more CLS info
1.8 Better metric updates, better logging, minor improvements
1.7 Log Events, Long Tasks and Long Animation Frames to the console that happen during and might interfere with the INP.
1.6 Better INP Breakdown, minor code improvements.
1.5 code improvements, layout improvements, added page experiments (defer javascript, disable javascript, disable third party scripts, lazy load images, defer background images & disable webfonts).
1.4 left side menu, more information about render blocking resources and direct links to PSI, CrUX dashboard and W3C.
1.2 added lots of LCP information like preloading,  fetchpriority, rendering breakdown, first or third party etc.
Technical
- Version
- 1.20
- Manifest
- V3
- Size
- 2.51MiB
- Min Chrome
- 88
- Languages
- 1
- Featured
- Yes
Metadata
- ID
- mcffmgagphgpgkdclllnilokablhjcge
- Developer ID
- u389db05ec5aa34cf1d5c95f1cd261bc4
- Developer Email
- [email protected]
- Created
- Oct 29, 2022
- Last Updated (Store)
- Mar 6, 2026
- Last Scraped
- Jun 6, 2026
- Website
- corewebvitals.io
- Support URL
- https://www.corewebvitals.io/contact
- Privacy Policy
- https://www.corewebvitals.io/privacy
Similar extensions
Alternatives to Core Web Vitals Visualizer, ranked by description similarity.
Site Speed Insights: Web Vitals Visualizer
Analyze and visualize your website’s Core Web Vitals (LCP, INP, CLS, FCP, TTFB) in real-time
21
Core SERP Vitals
Show the Core Web Vitals data from the Chrome User Experience Report in the Google Search Results.
4.0K
★ 3.4
Core Web Vitals Test
Check Core Web Vitals and compare metrics for desktop and mobile devices. Check pagespeed insights using our Chrome extension.
8.0K
★ 4.9
LightScout - Core Web Vitals Monitor
Track all 6 Core Web Vitals as you browse. Color-coded ratings, session grouping, CSV/JSON export, and Google Sheets sync.
2
Web Vitals
Measure Web Vitals
79
Web Performance Overlay
A lightweight Chrome extension that displays Core Web Vitals (LCP, FCP, CLS, TTFB) directly on any website. Capture a “performance…
21
★ 5.0
Web Vitals
Measure metrics for a healthy site, Server Info, Web info, SEO Analysis & Accessibility checks.
2.0K
★ 5.0
Keep Optimized: On-Page SEO Checker
Get a free on-page SEO check with Keep Optimized. Spot issues and improve your on-page SEO directly from your browser.
104
★ 5.0
Data sourced from the Chrome Web Store · last verified Jun 6, 2026.