
Rest API Inspector
Inspect, filter and export REST API calls from any web app. View headers, payloads, timing and status. Export as HAR or JSON.
As of June 2026, Rest API Inspector has 1,000 users and a 4.33/5 rating from 6 reviews in the Developer Tools category.
Usersup 2.8 percent+2.8%
1.0K
1,000
Ratingno change0%
4.33
6 reviews
Reviewsno change0%
6
Version
2.0.0
Manifest V3
History
3 snapshotsTracking since Apr 1, 2026.
View as table
| Date | Users | Rating | Reviews | Version |
|---|---|---|---|---|
| Apr 1, 2026 | 973 | 4.33 | 6 | 2.0.0 |
| Apr 20, 2026 | 1.0K | 4.33 | 6 | 2.0.0 |
| Apr 25, 2026 | 1.0K | 4.33 | 6 | 2.0.0 |
| Now | 1.0K | 4.33 | 6 | 2.0.0 |
Permissions & access
- Permissions
- tabsactiveTab
- Host access
- <all_urls>
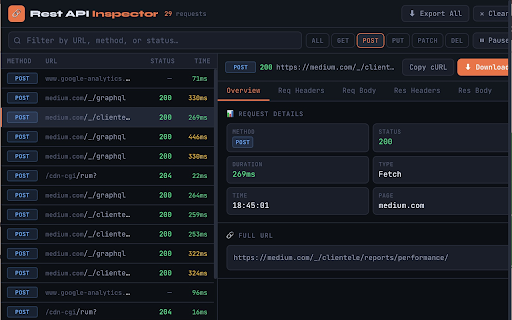
Screenshots


About
Rest API Inspector — Professional API Debugging Tool for Developers
===================================================================

Rest API Inspector is a powerful, lightweight Chrome extension built for frontend developers, full-stack engineers, QA testers, and anyone who needs to understand exactly what API calls their web application is making. Whether you are debugging a production issue, testing a new feature, auditing third-party integrations, or verifying that your app communicates correctly with a backend, Rest API Inspector gives you instant, clear visibility into every HTTP request — without ever leaving your browser tab.

Unlike the built-in Network tab in Chrome DevTools, Rest API Inspector is designed to be fast to open, easy to navigate, and focused purely on REST API traffic. It sits quietly in your toolbar, capturing requests in the background the moment you load a page. One click on any request reveals its complete profile: method, status, duration, all request and response headers, request body, and response body — with JSON automatically pretty-printed and syntax-highlighted.

Built on Chrome Manifest V3, the extension uses the absolute minimum permissions required — just tabs and activeTab. Everything is stored in memory only, never written to disk, and never sent anywhere.


━━━━━━━━━━━━━━━━━━━━━━━━━━━━━━━━━━━━━━━━━━━━
CORE FEATURES
━━━━━━━━━━━━━━━━━━━━━━━━━━━━━━━━━━━━━━━━━━━━

LIVE REQUEST CAPTURE
The moment you open a web page, the extension begins capturing every outgoing API call. No configuration, no code changes. The extension patches both XMLHttpRequest and fetch() at the MAIN world level, which means it intercepts requests from the page's own code, third-party libraries, embedded widgets, and analytics scripts — anything running in that tab.

IN-PROGRESS INDICATORS
Requests appear instantly with a live spinner while in flight. The row updates automatically when the response arrives, showing the final status code and exact duration. This live view is useful for tracking slow requests, watching long-polling calls, or understanding the order in which parallel requests resolve.

RESPONSE TIME TRACKING
Every request is timed from the moment it is sent to the moment the full response is received, colour-coded for instant scanning:
  • Green  — under 300ms  (fast)
  • Yellow — 300ms to 1s  (acceptable)
  • Red    — over 1s      (slow — investigate)

HTTP METHOD BADGES
Every request is labelled with its HTTP method in a colour-coded badge:
  • GET    — green       • POST   — blue
  • PUT    — yellow      • PATCH  — purple
  • DELETE — red         • HEAD   — cyan

STATUS CODE COLOUR CODING
  • 2xx Success      — green     • 3xx Redirect    — cyan
  • 4xx Client Error — yellow    • 5xx Server Error — red


━━━━━━━━━━━━━━━━━━━━━━━━━━━━━━━━━━━━━━━━━━━━
FILTERING & SEARCH
━━━━━━━━━━━━━━━━━━━━━━━━━━━━━━━━━━━━━━━━━━━━

METHOD FILTER BUTTONS
One-click buttons to show only GET, POST, PUT, PATCH, or DELETE requests. The active filter is highlighted. Switching is instant.

LIVE TEXT SEARCH
The search bar filters the request list as you type — by any part of the URL, by method name, or by status code. The text search and method filter work simultaneously. For example: filter to POST, then search for "auth" to find your authentication endpoint immediately.


━━━━━━━━━━━━━━━━━━━━━━━━━━━━━━━━━━━━━━━━━━━━
FIVE-TAB DETAIL PANEL
━━━━━━━━━━━━━━━━━━━━━━━━━━━━━━━━━━━━━━━━━━━━

Click any request to open its complete detail view. Five tabs cover every dimension of the exchange:

OVERVIEW TAB
  • HTTP method, status code and text, duration, request type
  • Exact timestamp, source page URL
  • Full URL in a copyable code block

REQUEST HEADERS TAB
All headers sent with the request, sorted alphabetically in a clean two-column table. Includes Content-Type, Authorization, custom headers — everything.

REQUEST BODY TAB
The payload sent with the request, rendered intelligently:
  • JSON — parsed, pretty-printed, syntax-highlighted
  • FormData — decoded as readable key-value pairs, File entries show filename and size
  • URL-encoded — displayed as readable text
  • Binary / Blob — labelled with MIME type and byte count
  • Empty body — clearly labelled rather than left blank

RESPONSE HEADERS TAB
All headers returned by the server, sorted alphabetically. Check CORS headers, Cache-Control, Set-Cookie, rate limit headers, and any custom API response headers.

RESPONSE BODY TAB
The full response from the server:
  • Valid JSON — automatically parsed, pretty-printed and syntax-highlighted
  • Other text (HTML, XML, plain text) — shown verbatim
  • Large responses over 500KB — truncated with a note showing the original size

All tabs include a hover-to-reveal Copy button so you can copy any content with a single click.


━━━━━━━━━━━━━━━━━━━━━━━━━━━━━━━━━━━━━━━━━━━━
EXPORT & SHARING
━━━━━━━━━━━━━━━━━━━━━━━━━━━━━━━━━━━━━━━━━━━━

EXPORT ALL AS HAR
Saves all visible requests as a standard HAR (HTTP Archive) 1.2 file. Compatible with:
  • Chrome DevTools (Network tab → Import HAR)
  • Postman (generate a collection from real traffic)
  • Charles Proxy, Fiddler, WebPageTest
  • Any HAR viewer or analysis tool

DOWNLOAD SINGLE REQUEST
Saves the selected request as a self-contained JSON file including the method, URL, status, duration, all headers, request body, and response body. The filename is auto-generated from the method and URL path.

COPY AS CURL
Copies a complete, ready-to-run curl command to your clipboard:

  curl -X POST 'https://api.example.com/users' \
    -H 'Content-Type: application/json' \
    -H 'Authorization: Bearer eyJhbGc...' \
    -d '{"name":"Alice","email":"[email protected]"}'

Paste directly into a terminal to reproduce any request — useful for isolating API behaviour or sharing a reproducible call with a backend engineer.


━━━━━━━━━━━━━━━━━━━━━━━━━━━━━━━━━━━━━━━━━━━━
RECORDING CONTROLS
━━━━━━━━━━━━━━━━━━━━━━━━━━━━━━━━━━━━━━━━━━━━

PAUSE & RESUME
Freeze capture instantly. The list stops updating while existing requests stay visible. Resume with one click. Useful when you want to read through a set of requests without new ones pushing them down the list.

CLEAR ALL
Wipes the request list for the current tab. Use this to dismiss page-load background traffic, perform a specific user action, then inspect only the requests that action triggered — all without reloading the page.

BADGE COUNTER
The extension icon shows a live badge with the total request count for the active tab, updating in real time. Capped at 99+ for visual tidiness on long sessions.

PER-TAB ISOLATION
Each browser tab has its own independent request log. Switching tabs in Chrome automatically switches the inspector to show that tab's requests. Closing a tab permanently deletes its data from memory.

500-REQUEST ROLLING WINDOW
The 500 most recent completed requests are kept per tab. Once the limit is reached, the oldest entry is dropped when a new one arrives — keeping memory usage stable during long sessions.


━━━━━━━━━━━━━━━━━━━━━━━━━━━━━━━━━━━━━━━━━━━━
PRIVACY & SECURITY
━━━━━━━━━━━━━━━━━━━━━━━━━━━━━━━━━━━━━━━━━━━━

Zero data collection. Full stop.

WHAT THE EXTENSION DOES:
  • Stores captured requests in JavaScript memory, scoped to the current tab
  • Displays that data in the popup UI when you open it
  • Writes data to a file only when you explicitly click Export or Download

WHAT THE EXTENSION NEVER DOES:
  • Never sends request data, URLs, headers, or bodies to any external server
  • Never writes anything to disk, chrome.storage, or localStorage
  • Never communicates with any analytics platform or third-party service
  • Never collects personally identifiable information
  • Never tracks which websites you visit or which APIs you call

PERMISSIONS:
  • tabs       — to identify the active tab and show the correct request list
  • activeTab  — to associate captured requests with their source tab
  • host_permissions (<all_urls>) — to inject the interceptor across all domains

No storage permission. No webRequest permission. No background data collection.
When you close a tab, all captured data for that tab is permanently gone.


━━━━━━━━━━━━━━━━━━━━━━━━━━━━━━━━━━━━━━━━━━━
WHO IS THIS FOR?
━━━━━━━━━━━━━━━━━━━━━━━━━━━━━━━━━━━━━━━━━━━

FRONTEND DEVELOPERS
Debug API integration issues, verify request payloads, check headers are being sent correctly, and confirm responses match expectations — without opening DevTools.

FULL-STACK ENGINEERS
See exactly what the frontend sends to your backend. Compare actual payloads against what your endpoint expects. Export as cURL to reproduce calls directly against the server.

QA ENGINEERS & TESTERS
Verify that user actions trigger the correct API calls. Check request bodies contain the right data. Confirm status codes match the API contract. Export sessions as HAR files for bug reports.

PERFORMANCE ENGINEERS
Identify slow API calls instantly with colour-coded timing. Spot requests over 1 second at a glance. Export HAR for waterfall analysis.

SECURITY REVIEWERS
Audit what data a web application sends to external services. Inspect headers for sensitive information. Review third-party API destinations and payloads.

━━━━━━━━━━━━━━━━━━━━━━━━━━━━━━━━━━━━━━━━━━━━
GETTING STARTED
━━━━━━━━━━━━━━━━━━━━━━━━━━━━━━━━━━━━━━━━━━━━

1. Click "Add to Chrome"
2. Pin the extension via the puzzle-piece icon in your toolbar
3. Open any website or web application
4. Click the 🔗 icon — no page reload required
5. Interact with the page and watch requests appear live
6. Click any request to inspect its full headers and body
7. Filter, export, download, or copy as cURL
Technical
- Version
- 2.0.0
- Manifest
- V3
- Size
- 23.78KiB
- Min Chrome
- 92
- Languages
- 1
- Featured
- No
Metadata
- ID
- lmhkmmkefopogbadhkfcaccjnaihajbh
- Developer ID
- ueaf326bde5521a8ab4fe0de857162c61
- Developer Email
- [email protected]
- Created
- Aug 18, 2021
- Last Updated (Store)
- Mar 20, 2026
- Last Scraped
- Jun 8, 2026
- Website
- —
- Support URL
- —
- Privacy Policy
- —
Similar extensions
Alternatives to Rest API Inspector, ranked by description similarity.
API Request Logger
Developer tool that logs all API calls made by websites. Shows method, headers, payload, and response in a clean dev-friendly UI.
44
Fetch Monitor
Monitor all network requests
12
Network Request Capturer Pro
Professional network debugging tool. Capture, analyze and export HTTP requests with advanced filtering.
216
★ 5.0
ReloadScope - API Monitor & Network Tracker
Track, analyze & debug REST/JSON API requests. HTTP Network Inspector with session management, HAR export & request replay.
301
★ 5.0
Filter Trace
Monitor all background requests and resources loaded by websites
65
★ 5.0
SocialAPIs Network Inspector
Capture network requests from any page and generate API code.
10
REST API Monitor
Monitor, log, and analyze REST API requests in real-time. Perfect for developers, QA engineers, and API analysts.
102
RequestScope
Monitor network requests and API failures with real-time insights
97
★ 5.0
Data sourced from the Chrome Web Store · last verified Jun 8, 2026.