
Chart Immerse
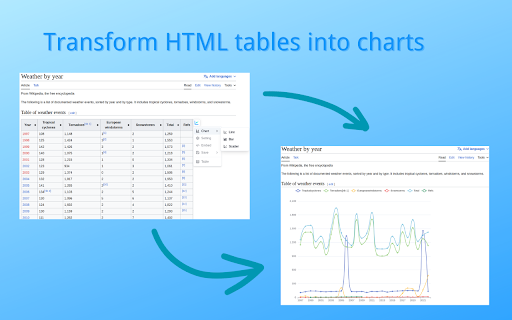
ChartImmerse is a powerful extension that seamlessly converts HTML tables from any website into visually stunning charts.
As of May 2026, Chart Immerse has 28 users in the Productivity category.
Usersup 27.3 percent+27.3%
28
28
Ratingno change0%
—
— reviews
Reviewsno change0%
—
Version
1.0.0
Manifest V3
History
2 snapshotsTracking since Apr 28, 2026.
View as table
| Date | Users | Rating | Reviews | Version |
|---|---|---|---|---|
| Apr 28, 2026 | 22 | — | — | 1.0.0 |
| May 25, 2026 | 24 | — | — | 1.0.0 |
| Now | 28 | — | — | 1.0.0 |
Permissions & access
- Permissions
- storage
- Host access
- None declared
Screenshots


About
Chart Immerse is a powerful Chrome extension that transforms HTML tables into interactive and visually stunning charts. With Chart Immerse, you can effortlessly convert tabular data into line graphs, bar charts, scatter plots, and mixed charts, enabling you to explore and present your data in a whole new way.

Features:
• Generate Interactive Charts: Seamlessly convert HTML tables into interactive charts, bringing your data to life with just a few clicks.
• Multiple Chart Types: Create a variety of chart types, including line graphs, bar charts, scatter plots, and mixed charts, allowing you to choose the best representation for your data.
• Customizable Settings: Tailor your charts to suit your needs by customizing chart titles, axis labels, chart size, and other settings, ensuring your visualizations are personalized and impactful.
• Shareable Chart Links: Easily share your charts with others by generating unique and shareable links. Collaborate, present, and showcase your insights effortlessly.
• Export as Image: Save your charts as high-quality PNG or JPG images, enabling you to use them in presentations, reports, or any other medium you prefer.
• User-Friendly Interface: Enjoy a user-friendly interface that makes chart creation and customization intuitive and accessible to users of all levels.

Chart Immerse offers a freemium model, allowing users to access and utilize the core features of the extension for free. With the free version, you can generate charts with default settings,. For users who require advanced capabilities, Chart Immerse also offers a premium upgrade. Unlocking the premium features grants you access to enhanced customization options and other exclusive functionalities, empowering you to create even more impactful visualizations.
Technical
- Version
- 1.0.0
- Manifest
- V3
- Size
- 527KiB
- Min Chrome
- 88
- Languages
- 1
- Featured
- No
Metadata
- ID
- idipmeekkieiochcpceciidpaeibafmp
- Developer ID
- udef7e358b2263b12886cd45dac591af4
- Developer Email
- [email protected]
- Created
- Nov 17, 2023
- Last Updated (Store)
- Nov 21, 2023
- Last Scraped
- May 25, 2026
- Website
- chartimmerse.com
- Support URL
- —
- Privacy Policy
- https://www.chartimmerse.com/privacy-policy
Similar extensions
Alternatives to Chart Immerse, ranked by description similarity.
MonChart | No-code HTML Chart Builder
Turn any HTML table into an embed interactive chart. Edit data on the fly, apply magic cleaning, export to Excel or save it.
93
Table to Chart
Click on any table to visualize its data as a chart
7
★ 5.0
Chart Maker
Simple online chart maker and generator to quickly create graphs and diagrams. Works with circle, line and pie chart graph maker
114
★ 5.0
chartr.ai
Turn ideas and content instantly into beautiful, shareable charts
5
★ 5.0
Graph maker
Introducing Graph maker online. Creating informative graphs: bar graph maker, pie graph maker, line graph maker and others.
259
★ 5.0
Pie Chart Generator
Use Pie Chart Generator — the ultimate pie chart maker for quick graph visualization.
15
Pie Chart Maker
Create a diagram with Pie Chart Maker — the ultimate pie chart generator for quick graph visualization.
19
Bar Graph Maker
Use Bar Graph Maker for create chart in seconds — the ultimate Bar Graph generator for quick data visualization.
44
Data sourced from the Chrome Web Store · last verified May 25, 2026.