
WebGPU Inspector
DevTools debugger and profiler for WebGPU — inspect objects, capture frames, edit shaders live, and analyze GPU performance.
As of June 2026, WebGPU Inspector has 2,000 users and a 4.92/5 rating from 13 reviews in the Developer Tools category.
Usersdown 66.7 percent−66.7%
2.0K
2,000
Ratingno change0%
4.92
13 reviews
Reviewsno change0%
13
Version
1.4.3
Manifest V3
90-day change · In the last 90 days this extension lost 4.0K users, 4 version updates.
History
10 snapshotsTracking since Apr 6, 2026.
View as table
| Date | Users | Rating | Reviews | Version |
|---|---|---|---|---|
| Apr 6, 2026 | 6.0K | 4.92 | 13 | 1.0.1 |
| Apr 17, 2026 | 8.0K | 4.92 | 13 | 1.0.2 |
| Apr 22, 2026 | 3.0K | 4.92 | 13 | 1.0.2 |
| May 7, 2026 | 2.0K | 4.92 | 13 | 1.0.2 |
| May 11, 2026 | 4.0K | 4.92 | 13 | 1.0.2 |
| May 23, 2026 | 2.0K | 4.92 | 13 | 1.0.2 |
| May 28, 2026 | 4.0K | 4.92 | 13 | 1.1.2 |
| Jun 2, 2026 | 7.0K | 4.92 | 13 | 1.1.2 |
| Jun 11, 2026 | 7.0K | 4.92 | 13 | 1.3.0 |
| Jun 24, 2026 | 7.0K | 4.92 | 13 | 1.4.3 |
| Now | 2.0K | 4.92 | 13 | 1.4.3 |
Changelog
- Jun 2, 2026description
WebGPU Inspector is a Chrome Developer Tools extension for debugging WebGPU content. It intercepts all WebGPU objects and commands, allowing you to inspect information about any GPU object.

* Inspect any WebGPU object, with a stacktrace for where it was created.
* Capture frames, including all commands, buffers, textures, and render pass results.
* Catch errors compiling shader modules and pipelines.
* Display textures, at any mip level.
* Edit shaders live on the page to debug and test shader changes.
* Debug shaders (experimental, limited to compute shaders).
* Plot frame times and GPU object counts over time for profiling information.
* View uniform and storage buffer content used for draw and dispatch calls.
* Record all commands and data used to render a set of frames, generating a standalone HTML file that can recreate the render.
WebGPU Inspector is the extension for debugging and profiling WebGPU applications — RenderDoc-style graphics debugging, right inside Chrome DevTools. 🔍 Inspect • Browse every live WebGPU object with full details and the stack trace showing exactly where it was created. • Plot frame times and GPU object counts over time to track performance. • Texture viewer, look at individual pixel values. • Edit shaders live on the page to test and fix changes without reloading. 🖼️ Capture • Capture one or more frames with all of their commands, buffers, textures, and render pass results. • Auto-inject render and compute pass timestamp queries to measure performance and identify bottlenecks. • Debug shaders (experimental, compute only for now). Step through shader execution, watching variable values. • Save and reload captures, open in multiple tabs or windows, useful for A | B analysis. 🔵 Record • Record the commands and data for a set of frames and export a standalone HTML or binary file that reproduces the render anywhere — perfect for bug reports and regression tests. • Play back the recorded frame, with the ability to step through the commands to render up to that point. • Edit and disable commands in the recording to help investigate rendering issues. - Jun 2, 2026short_description
WebGPU Inspector Debugging Tools
DevTools debugger and profiler for WebGPU — inspect objects, capture frames, edit shaders live, and analyze GPU performance.
Permissions & access
- Permissions
- None declared
- Host access
- None declared
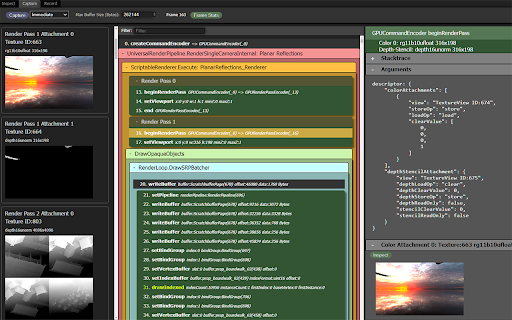
Screenshots


About
WebGPU Inspector is the extension for debugging and profiling WebGPU applications — RenderDoc-style graphics debugging, right inside Chrome DevTools.

🔍 Inspect
    • Browse every live WebGPU object with full details and the stack trace showing exactly where it was created.
    • Plot frame times and GPU object counts over time to track performance.
    • Texture viewer, look at individual pixel values.
    • Edit shaders live on the page to test and fix changes without reloading.

🖼️ Capture
    • Capture one or more frames with all of their commands, buffers, textures, and render pass results.
    • Auto-inject render and compute pass timestamp queries to measure performance and identify bottlenecks.
    • Debug shaders (experimental, compute only for now). Step through shader execution, watching variable values.
    •  Save and reload captures, open in multiple tabs or windows, useful for A | B analysis.

🔵 Record
    • Record the commands and data for a set of frames and export a standalone HTML or binary file that reproduces the render anywhere — perfect for bug reports and regression tests.
    • Play back the recorded frame, with the ability to step through the commands to render up to that point.
    • Edit and disable commands in the recording to help investigate rendering issues.
Technical
- Version
- 1.4.3
- Manifest
- V3
- Size
- 363KiB
- Min Chrome
- 116
- Languages
- 1
- Featured
- No
Metadata
- ID
- holcbbnljhkpkjkhgkagjkhhpeochfal
- Developer ID
- u401f425142febf05cb1fe80c0c177c87
- Developer Email
- [email protected]
- Created
- Feb 8, 2024
- Last Updated (Store)
- Jun 8, 2026
- Last Scraped
- Jun 24, 2026
- Website
- —
- Privacy Policy
- —
Similar extensions
Alternatives to WebGPU Inspector, ranked by description similarity.
webgpu-devtools
WebGPU devtools for debugging WebGPU applications
881
★ 5.0
WebGPU Dev Extension
Provide some features helpful for WebGPU Development
347
★ 4.5
Is it WebGPU?
Extension that lets you know when a page is using WebGPU
179
★ 5.0
OC Web Inspector
Highlight all section elements on the page.
16
★ 5.0
WebMCP Inspector
Developer tool for inspecting, testing, and debugging WebMCP tools
508
★ 5.0
Web Storage Inspector
A simple, efficient developer tool for inspecting, editing, and managing Local Storage and Session Storage.
6
Web Content Inspector
Inspect text, media, layout, and spacing. Tool created by Mayantha Jayasinghe.
5
GraphQL Inspector
A DevTools panel to inspect GraphQL requests.
50
Data sourced from the Chrome Web Store · last verified Jun 24, 2026.