
Luna Debugger
Debug Luna Playable develop builds in the browser
As of June 2026, Luna Debugger has 1,000 users and a 5.00/5 rating from 3 reviews in the Developer Tools category.
Usersup 6.8 percent+6.8%
1.0K
1,000
Ratingno change0%
5.00
3 reviews
Reviewsno change0%
3
Version
0.3.2
Manifest V3
History
3 snapshotsTracking since Apr 1, 2026.
View as table
| Date | Users | Rating | Reviews | Version |
|---|---|---|---|---|
| Apr 1, 2026 | 936 | 5.00 | 3 | 0.3.2 |
| May 3, 2026 | 941 | 5.00 | 3 | 0.3.2 |
| Jun 2, 2026 | 952 | 5.00 | 3 | 0.3.2 |
| Now | 1.0K | 5.00 | 3 | 0.3.2 |
Permissions & access
- Permissions
- activeTabstoragecontextMenusscripting
- Host access
- http://*/, https://*/
Screenshots
About
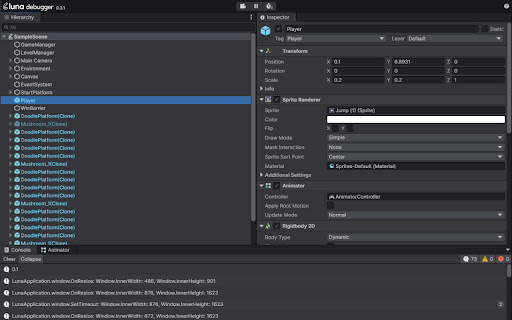
The Luna Debugger is a powerful tool that allows developers using Playable Plugin to inspect and debug develop builds directly in the browser. The interface will be familiar to users of the Unity Editor, we've incorporated similar components like hierarchy and inspector panels so that you can debug a Playable Plugin build in real time just as easily as you would a Unity scene.


How to get started
Install the Luna Debugger Chrome extension from the Chrome Web Store
Open a Playable Plugin develop build in Chrome
Use the keyboard shortcut Option + ⌘ + I (on macOS), or Shift + CTRL + I (on Windows/Linux), to open the Chrome DevTools panel
At the furthermost right of the DevTools tabs you should now see Luna, click this to open the debugger
Once the Luna Debugger is displayed in DevTools, you should see the hierarchy and inspector panels populated with information related to your scene in the develop build. What youre seeing is a live representation of your builds object hierarchy in the Luna engine.

Additionally, most of what you see in the inspector panel is editable in real time and we provide tools to move freely around the scene and pause it.


Hierarchy Panel
Here you can see the full hierarchy of all game objects in your exported build, you can click game objects to open them in the inspector panel and expand child objects. The hierarchy panel is useful for a number of reasons whilst debugging your build:

Determining whether a game object is instantiated and active in the scene
Determining whether a game object is a prefab


Inspector Panel
This is where youll find the values and attributes that apply to a game object in your scene. All the fields displayed in this panel are editable and any resulting changes can be observed instantly in the running scene. Viewing and editing game objects here can useful for the following reasons:

Activating disabled game objects
Changing the position, rotation and scale of an object
Technical
- Version
- 0.3.2
- Manifest
- V3
- Size
- 736KiB
- Min Chrome
- 88
- Languages
- 1
- Featured
- No
Metadata
- ID
- gkmdjmmdamjcmlhaakmlnfjldciojbjf
- Developer ID
- u936c8f7ae684017a60950fc34a4a8050
- Developer Email
- [email protected]
- Created
- Jan 19, 2024
- Last Updated (Store)
- Jan 19, 2024
- Last Scraped
- Jun 2, 2026
- Website
- —
- Support URL
- —
- Privacy Policy
- —
Similar extensions
Alternatives to Luna Debugger, ranked by description similarity.
Coconutool
Chrome and DevTools extension for debugging Cocos Creator V3 games.
1.0K
★ 4.9
Solid Devtools
Chrome Developer Tools extension for debugging SolidJS applications.
5.0K
★ 5.0
Phaser Data Inspector
Inspect Phaser game data and state
39
cc-inspector
Debug Cocos Creator Games with easy, display node trees and node properties, it works with both Cocos Creator v2 and v3
6.0K
★ 4.9
CSS Debugger
DevTools-like CSS debugger with Box Model tooltip
37
Backbone Debugger
Developer Tools extension for debugging Backbone.js applications.
3.0K
★ 4.5
Excalibur Dev Tools
Excalibur.js browser plugin for debugging your games
645
★ 5.0
DevLens — Design Handover Inspector
Stop guessing pixels. Inspect any element's box model, typography, colors, spacing, and layout properties.
9
★ 5.0
Data sourced from the Chrome Web Store · last verified Jun 2, 2026.