
Salesforce Experience Cloud Debugger
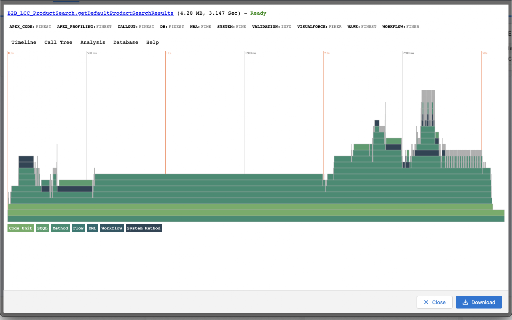
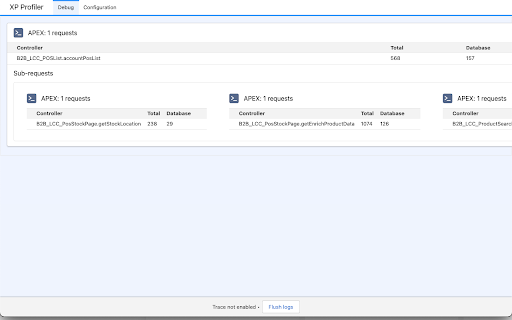
This light debugging tool provides view on APEX request tree to understand application bottlenecks
As of May 2026, Salesforce Experience Cloud Debugger has 35 users in the Developer Tools category.
Usersdown 5.4 percent−5.4%
35
35
Ratingno change0%
—
— reviews
Reviewsno change0%
—
Version
1.3.0
Manifest V3
History
3 snapshotsTracking since Apr 1, 2026.
View as table
| Date | Users | Rating | Reviews | Version |
|---|---|---|---|---|
| Apr 1, 2026 | 37 | — | — | 1.3.0 |
| May 1, 2026 | 34 | — | — | 1.3.0 |
| May 30, 2026 | 37 | — | — | 1.3.0 |
| Now | 35 | — | — | 1.3.0 |
Permissions & access
- Permissions
- cookiesdownloadsscriptingstorage
- Host access
- <all_urls>
Screenshots
About
This cross-browser extension provides capability to debug traces directly in the browser developer tools for Experience Cloud Websites.

The extension is developed as cross-browser, but has been only tested on Chrome.

It makes use of https://github.com/financialforcedev/debug-log-analyzer to display log information.

Agent icons created by Freepik - Flaticon: https://www.flaticon.com/free-icons/agent
Technical
- Version
- 1.3.0
- Manifest
- V3
- Size
- 5.56MiB
- Min Chrome
- 88
- Languages
- 1
- Featured
- No
Metadata
- ID
- gbhgnplfajpgpdiflbpfllfolnamcnac
- Developer ID
- ucaf4e27822f8ceb8272b61fdd430ad30
- Developer Email
- [email protected]
- Created
- Sep 16, 2022
- Last Updated (Store)
- Sep 27, 2022
- Last Scraped
- May 30, 2026
- Website
- —
- Privacy Policy
- —
Similar extensions
Alternatives to Salesforce Experience Cloud Debugger, ranked by description similarity.
Salesforce Speedy Debugger
Easy way to check the Debug logs
3.0K
★ 4.6
Trackingplan
Trackingplan helps you debug your analytics live in your browser.
104
★ 5.0
Seacloud Software - Salesforce Debug Inspector
Inspect Salesforce data and debug logs.
12
FPS extension
This extension shows a current FPS(frames per second) on a web page.
10.0K
★ 3.3
Php Laravel & CodeIgniter Debugger
Monitor Laravel, CodeIgniter & PHP applications in Chrome Side Panel. View SQL queries, execution time, memory usage.
47
Agentforce AI Shortcuts
Floating shortcut menu for Salesforce pages.
12
★ 5.0
ALT-DEV TOOLS
A powerful sidebar DevTools alternative — Elements, Console, Network, Sources & Application panels right in your browser sidebar
—
★ 5.0
AH Debugger
Debug analytics and marketing pixels in real time with AH Debugger.
156
★ 5.0
Data sourced from the Chrome Web Store · last verified May 30, 2026.