
Business Analysis Software
Business Analysis builds a business forecast (up to 10 years), determines business value, break even point and optimum price point.
As of May 2026, Business Analysis Software has 237 users and a 1.00/5 rating from 2 reviews.
Usersdown 10.9 percent−10.9%
237
237
Ratingno change0%
1.00
2 reviews
Reviewsno change0%
2
Version
2023
History
3 snapshotsTracking since Apr 1, 2026.
View as table
| Date | Users | Rating | Reviews | Version |
|---|---|---|---|---|
| Apr 1, 2026 | 266 | 1.00 | 2 | 2023 |
| Apr 30, 2026 | 265 | 1.00 | 2 | 2023 |
| May 29, 2026 | 251 | 1.00 | 2 | 2023 |
| Now | 237 | 1.00 | 2 | 2023 |
Permissions & access
- Permissions
- None declared
- Host access
- None declared
Screenshots


About
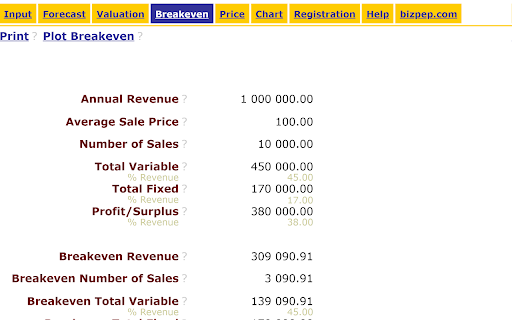
Business Analysis Software will quickly build a forecast for your business (up to 10 years), determine the business value, break-even point and optimum price point.

Business Forecast

The Business Forecast Module generates a forecast to assess business performance for up to a 10 year period. The forecast is built by considering future changes in the macro and micro business environment and the impact on current business performance. From this basic data future revenue and costs are determined. Sensitivity Analysis (Optimistic, Expect and Pessimistic) can be applied to the generated forecast allowing a range of scenarios to be easily tested. This forecast provides a high level strategic budget overview, assists in the identification of business opportunities and risks, and delivers a quantifiable framework for business development strategies and actions.
Sensitivity Analysis applied to a business forecast allows a range of possible outcomes to be reviewed. Providing worst case to best case scenarios and allowing the business manager to assess, monitor and implement actions to best deal with these possibilities.

Business Valuation

The Business Valuation Module applies the base Forecast Analysis to generate a Business Valuation. It considers Owners Earning Power and the Required Return on Investment to develop a Business Valuation that reflects the potential to value add and considers the future business environment. This valuation provides strong support for business purchase, sale or financing negotiations. Outputs include up to a 10 year Forecast, Sensitivity Analysis, Investment Return, Net Present Value Analysis, and calculated Business Valuation (Expected, Optimistic and Pessimistic). Using a business forecast that considers the dynamic environment in which the business operates and the potential for developing future opportunities is the basis of a verifiable business valuation. Applying Sensitivity Analysis allows a range of scenarios and corresponding valuations to be analyzed.

Break-even Analysis

The Breakeven Analysis Module applies current performance data to determine breakeven points for Annual Revenue and Number of Sales. It applies the Annual Revenue, Total Variable, and Total Fixed values with the Breakeven Data values Average Sale Price and Number of Sales to calculate breakeven points. A Breakeven plot shows Annual Revenue and Total Expenses by Number of Sales. The Breakeven point is where Revenue and Expenses cross. Below this point the business surplus is negative (loss) and above this point the business surplus is positive (profit). The amount of surplus is the difference between the Annual Revenue and Total Expenses. Break even analysis is a relatively simple and effective indicator of a businesses profit relationship to revenue and in turn number of sales. It can also provide insight into the impact of future sales volume changes on business profit.

Price Analysis

The Price Analysis Module determines the impact of a price change on your business. It applies current Annual Revenue, Total Variable, and Total Fixed values with the Price Data values Sale Price Change % and Number of Sales Change % to project business surplus over a range of prices. Price Analysis projects outcomes for pricing from 50% to 200% of the current price and calculates the optimum price. The optimum price provides the highest surplus (profit). It can be utilized to test the impact of pricing changes on revenue and surplus and identify the Optimum Pricing to maximize business surplus. A Price plot shows Annual Revenue and Profit/Surplus by Average Sale Price. The optimum Average Sale Price is where Profit/Surplus is highest. By stepping through price ranges of 50% to 200% of the current Average Sale Price, calculating the corresponding Profit/Surplus and identifying the point of maximum Profit/Surplus the optimum Average Sale Price is determined.
Technical
- Version
- 2023
- Manifest
- —
- Size
- 4.84KiB
- Min Chrome
- 88
- Languages
- 1
- Featured
- No
Metadata
- ID
- fanfpdjknmnjgjjnlfpjfblghfiigbof
- Developer ID
- u2e496e55f55e8c1cbb259b7caea405a7
- Developer Email
- [email protected]
- Created
- Feb 12, 2013
- Last Updated (Store)
- Jun 25, 2023
- Last Scraped
- May 29, 2026
- Website
- https://bizpep.com/
- Privacy Policy
- —
Similar extensions
Alternatives to Business Analysis Software, ranked by description similarity.
Business Valuation
Business Valuation application with a 3 year business forecast and calculated business valuation.
61
★ 1.0
Dryrun
The simple way to picture revenue, profit and cash flow scenarios.
124
★ 3.7
Business Process Simulator
Business process simulation modeling service
10.0K
★ 4.3
ABC Analysis
Advanced ABC, XYZ, and RFM analysis for inventory optimization.
4
Profitl - Amazon FBA Deal Analysis Tool
Profitl determines the best FBA deals wherever you are - in-store or online - through two solutions for one monthly price.
1.0K
★ 4.7
Steam Revenue Analyzer
Estimate game revenue directly from Steam store pages.
67
SellerSprite Profit - FBA Calculator for free
Free Amazon profit calculator by SellerSprite. Estimate product profitability across marketplaces and optimize pricing with ease.
468
Deal Analyzer
Analyze businesses for sale on business buying marketplaces.
458
★ 5.0
Data sourced from the Chrome Web Store · last verified May 29, 2026.