
JavaScript Profiler
JavaScript Code Execution Analysis, real-time, 24x7. Provided by Germain UX
As of May 2026, JavaScript Profiler has 1,000 users and a 4.11/5 rating from 9 reviews in the Developer Tools category.
Usersno change0%
1.0K
1,000
Ratingno change0%
4.11
9 reviews
Reviewsno change0%
9
Version
2024.1.0
Manifest V3
Permissions & access
- Permissions
- debuggerstorage
- Host access
- <all_urls>
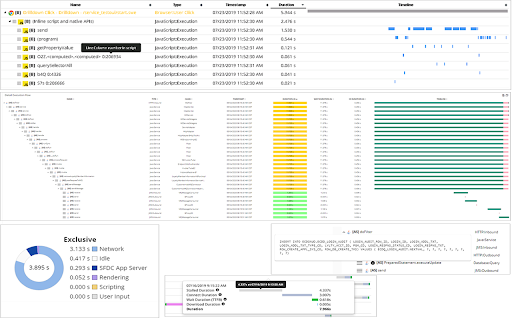
Screenshots
About
Features:
- Analyze JavaScript execution, in real-time, 24x7
- Correlate JavaScript calls with Application Back-end Code (e.g Java, C#, Python, Php, etc), Database SQL, Integration, etc
- All the above metrics can viewed on Germain UX dashboard (onPremise or cloud instance: https://germainux.com/cloud-login)
- Automate Task (Alert, Data Update, Service Restart, Reporting, etc)
- For all your users or a targeted user

Benefits:
- Identify whether a User Experience issue is caused by slow or failing JavaScript, browser, network, infrastructure, application, database, and deep dive within the code (JS or backend), in real-time, 24x7
Technical
- Version
- 2024.1.0
- Manifest
- V3
- Size
- 13.87KiB
- Min Chrome
- 88
- Languages
- 1
- Featured
- No
Metadata
- ID
- cjffkpkljodmdajjbkcjeflmmhnackij
- Developer ID
- u10f2cdeafe3f9337c9bb60f6f70e2c0b
- Developer Email
- [email protected]
- Created
- Dec 7, 2020
- Last Updated (Store)
- Jul 2, 2024
- Last Scraped
- May 19, 2026
- Website
- —
- Privacy Policy
- https://germainux.com/data-privacy/
Similar extensions
Alternatives to JavaScript Profiler, ranked by description similarity.
Selenium Click Recorder (RPA bot)
An application to easily record Selenium script. Provided by Germain UX
1.0K
★ 4.5
FrontPartner
Analyze front-end performance: console, network, critical CSS, images, and loops in real-time.
3
★ 5.0
Atatus - Make your app faster and bug free
Real User Monitoring (RUM) and JavaScript Error Tracking for Web and Hybrid Apps.
88
★ 3.7
Show Data Variables
Powerful side panel browser extension that discovers, organizes, and helps inspect hidden or non-obvious page data across the DOM,…
11
Page Consumption Analyzer
Comprehensive page analysis: Performance, Security, SEO, UI, Programming, Storage & Cache metrics in real-time.
9
★ 5.0
AH Debugger
Debug analytics and marketing pixels in real time with AH Debugger.
156
★ 5.0
Edgio Developer Tools
Debug requests served by Edgio.
57
CAST
CAST helps you audit and plan web analytics and tracking. It runs in a side panel and can:
Crawl pages (auto or manual), capture…
22
Data sourced from the Chrome Web Store · last verified May 19, 2026.