
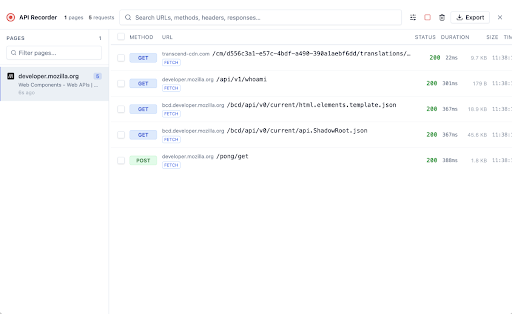
API Recorder
Record, inspect, and export network API calls organized by page. Full request/response capture with Postman export.
As of June 2026, API Recorder has 12 users in the Developer Tools category.
Usersno change0%
12
12
Ratingno change0%
—
— reviews
Reviewsno change0%
—
Version
1.0.0
Manifest V3
History
9 snapshotsTracking since Apr 20, 2026.
View as table
| Date | Users | Rating | Reviews | Version |
|---|---|---|---|---|
| Apr 20, 2026 | — | — | — | 1.0.0 |
| Apr 25, 2026 | — | — | — | 1.0.0 |
| May 2, 2026 | 2 | — | — | 1.0.0 |
| May 9, 2026 | 4 | — | — | 1.0.0 |
| May 13, 2026 | 8 | — | — | 1.0.0 |
| May 19, 2026 | 10 | — | — | 1.0.0 |
| May 26, 2026 | 12 | — | — | 1.0.0 |
| Jun 2, 2026 | 10 | — | — | 1.0.0 |
| Jun 8, 2026 | 7 | — | — | 1.0.0 |
| Now | 12 | — | — | 1.0.0 |
Permissions & access
- Permissions
- storageunlimitedStoragetabsactiveTabwindows
- Host access
- http://*/*, https://*/*
Screenshots
About
API Recorder — Capture, Inspect & Export Network Requests

A developer tool that records every API call made by any website you visit — organized by page, fully searchable, and exportable to Postman in one click. No DevTools juggling, no tab-switching, no lost data when you navigate away.

WHY API RECORDER?

DevTools Network tab is great for one page at a time, but it resets on navigation and disappears when you switch tabs. API Recorder runs quietly in the background across every page you visit, stores everything persistently, and presents it in a clean inspector that stays open beside your browser — ready whenever you need it.

Perfect for:

Frontend developers debugging REST/GraphQL APIs
QA engineers auditing what a web app actually sends and receives
Product engineers reverse-engineering third-party integrations
Security researchers inspecting network traffic
Anyone who has ever said "which endpoint did that button just call?"
CORE FEATURES

▸ Automatic capture — Intercepts all fetch() and XMLHttpRequest calls site-wide, from the moment a page loads. No manual setup, no injected scripts to configure.

▸ Organized by page — Requests are grouped under the page that made them. Switch between pages in the left panel; requests for that page appear instantly on the right. Navigate freely — data is never lost.

▸ Full request & response detail — For every captured call you can inspect:
• Request method, URL, status code, status text
• Complete request headers
• Request body (with JSON formatting)
• Complete response headers
• Response body (with JSON syntax highlighting)
• Duration (ms or seconds), response size, timestamp (HH:MM:SS)
• Content-Type, domain, request type (Fetch / XHR)

▸ Persistent storage — Captured data survives browser restarts, tab closes, and extension updates. Uses Chrome's unlimited storage quota so large datasets never get silently dropped.

▸ Stays open — Opens as a floating window that stays on screen regardless of where you click or which tab you visit. No more chasing a popup that closes the moment you interact with the page.

SEARCH & FILTER

Find exactly what you're looking for, even across hundreds of requests:

• Full-text search across URLs, methods, status codes, request/response headers, and body content simultaneously
• Glob pattern support — search .api.example.com, /users//orders, or graphql just as naturally as a plain substring
• Filter by HTTP method (GET, POST, PUT, PATCH, DELETE, OPTIONS, HEAD)
• Filter by status category (2xx Success, 3xx Redirect, 4xx Client Error, 5xx Server Error, Network Error)
• Filter by request type (Fetch API / XMLHttpRequest)
• Multi-domain filter — add several domain glob patterns (e.g. *.api.com and *.cdn.io) that are OR-matched against the request domain
• Debounced search input — glob matching runs after a short pause, keeping the UI fast even on large datasets

BULK SELECT & ACTIONS

• Checkbox on every request row — click to select individual entries
• Select All checkbox in the column header selects all visible (filtered) rows at once
• Selection persists as you switch between pages
• Selected-count indicator in the toolbar shows exactly how many are checked
• Export selected — choose a subset of requests and export just those to a Postman collection
• Delete selected — remove specific requests from the recording without clearing everything
• All bulk actions use the same Export and Delete buttons in the main toolbar — they automatically switch to "selected only" mode when you have a selection, or operate on all data when nothing is selected

EXPORT TO POSTMAN

Export any set of captured requests as a ready-to-import Postman Collection v2.1:

• Requests grouped into folders by page title
• Full URL parsed into protocol, host, path, and query parameters
• All request headers included
• Request body with correct language tag (JSON, XML, HTML, plain text)
• Captured response saved as an example inside the collection
• One-click download as a timestamped .json file

Import straight into Postman, Insomnia, or any tool that supports the Postman v2.1 schema.

COPY AS cURL

Every request has a "Copy as cURL" button in the detail panel. The generated command includes the correct method flag, all request headers, and the request body — ready to paste into a terminal and replay immediately.

RESIZABLE SPLIT-PANE LAYOUT

The pages panel and requests panel are separated by a draggable divider. Drag it left or right to give more space to whichever column you need. The detail panel below the request list is collapsible — minimize it when you're scanning through many requests.

RECORDING CONTROL

• Pause recording at any time with the stop button in the toolbar — useful when you want to freeze the current state before navigating
• Resume recording with one click to start capturing again
• The recording indicator (red dot with pulse animation) makes the current state unmistakable
• Clear all data resets everything with a single confirmation

CLEAN, READABLE INTERFACE

• Light theme with high-contrast colors — comfortable for long sessions
• Color-coded HTTP method badges (blue for GET, green for POST, orange for PUT, red for DELETE, etc.)
• Color-coded status codes (green for 2xx, yellow for 3xx, orange for 4xx, red for 5xx)
• JSON syntax highlighting in request and response body viewers
• HH:MM:SS timestamp column on every row so you can correlate requests to user actions
• Monospace font for URLs, bodies, and headers
• Error requests visually flagged with a red left border

PERMISSIONS EXPLAINED

API Recorder requests only what it needs:

• storage / unlimitedStorage — saves captured requests so data persists across sessions
• tabs — tracks which page each request belongs to, and reads page titles and favicons for the page list
• activeTab — allows the toolbar icon to open the recorder window
• windows — used to open and focus the floating recorder window
• http:/// and https:/// — needed to intercept network calls on any website (capture happens locally; no data leaves your machine)

All captured data is stored entirely on your device using Chrome's local storage. Nothing is uploaded to any server. The extension has no analytics, no telemetry, and no network requests of its own.

TECHNICAL NOTES

• Built on Manifest V3 with a service worker background script
• Intercepts both fetch() and XMLHttpRequest at the page level via a content script running in the MAIN world
• Stores up to 500 requests per page; older entries are automatically evicted to keep memory usage bounded
• Search uses compiled and cached regular expressions for glob matching — performance stays smooth even with hundreds of visible rows

Built for developers who want a persistent, searchable, exportable record of what their browser is actually doing on the network.
Technical
- Version
- 1.0.0
- Manifest
- V3
- Size
- 66.81KiB
- Min Chrome
- 88
- Languages
- 1
- Featured
- No
Metadata
- ID
- cdnfkigpkpalojgjolhodkbpmkmapaig
- Developer ID
- u0d5a61447e1a491606f6b0170c9e2f2b
- Developer Email
- [email protected]
- Created
- Apr 19, 2026
- Last Updated (Store)
- Apr 19, 2026
- Last Scraped
- Jun 8, 2026
- Website
- —
- Support URL
- —
- Privacy Policy
- —
Data sourced from the Chrome Web Store · last verified Jun 8, 2026.