
Prometheus Viewer
Helps investigate endpoints which return Prometheus metrics
As of May 2026, Prometheus Viewer has 492 users and a 5.00/5 rating from 2 reviews in the Developer Tools category.
Usersup 7.0 percent+7.0%
492
492
Ratingno change0%
5.00
2 reviews
Reviewsno change0%
2
Version
1.3.0
Manifest V3
History
5 snapshotsTracking since Apr 1, 2026.
View as table
| Date | Users | Rating | Reviews | Version |
|---|---|---|---|---|
| Apr 1, 2026 | 460 | 5.00 | 2 | 1.3.0 |
| Apr 21, 2026 | 487 | 5.00 | 2 | 1.3.0 |
| May 6, 2026 | 471 | 5.00 | 2 | 1.3.0 |
| May 17, 2026 | 485 | 5.00 | 2 | 1.3.0 |
| May 31, 2026 | 475 | 5.00 | 2 | 1.3.0 |
| Now | 492 | 5.00 | 2 | 1.3.0 |
Permissions & access
- Permissions
- None declared
- Host access
- None declared
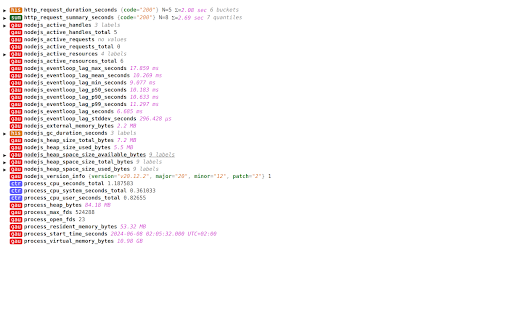
Screenshots


About
A Chrome Extension which will makes investigating Prometheus endpoints easier. If you're debugging an application locally or remotely using Chrome, looking at raw Prometheus output can be challenging. Using this extension, you get a visually improved view of your metrics which can be unfolded based on labels and hides away details.

Features:
- Pretty overview of metrics
- Formats values in human-readable units
- Groups metrics by labels
- Detailed view of histograms and summaries
- Tooltip with metric description
- Aggregates common labels
- Supports the OpenMetrics format
- Dark mode support
Technical
- Version
- 1.3.0
- Manifest
- V3
- Size
- 151KiB
- Min Chrome
- 88
- Languages
- 1
- Featured
- No
Metadata
- ID
- cbemcojgcihplgfjjdoplpfjmamiikcn
- Developer ID
- u9f0be8f16ad0dec6dda22bd0191ee0b2
- Developer Email
- [email protected]
- Created
- Jun 13, 2024
- Last Updated (Store)
- Aug 15, 2025
- Last Scraped
- May 31, 2026
- Website
- —
Similar extensions
Alternatives to Prometheus Viewer, ranked by description similarity.
Prometheus Formatter
Makes plain Prometheus/OpenMetrics endpoints easier to read.
3.0K
★ 4.8
Meta Debugger
Debug the head elements of any webpage in a comfortable way.
1.0K
★ 4.9
TechTracer
An extension for monitoring and analyzing network traffic
3
Extension Data
Quickly see stats for any chrome extension
113
★ 5.0
Dev Tools Panel
Overlay showing FPS, LCP, CLS, and other performance metrics on any page.
2
Pesticide for Chrome - Simple
Toggle CSS outlines to debug layouts easily.
933
★ 5.0
Performance Metrics
Displays system performance metrics (CPU & Memory) directly on the toolbar icon and integrates with DevTools for deeper insights.
37
★ 5.0
Mixpanel Debugger
Debugger for Mixpanel tracking events
16
★ 5.0
Data sourced from the Chrome Web Store · last verified May 31, 2026.