
Desmos Graphing Calculator
Beautiful, powerful, free math exploration! Brought to you by desmos.com
As of May 2026, Desmos Graphing Calculator has — users and a 4.58/5 rating from 1,307 reviews.
Usersno change0%
—
—
Ratingno change0%
4.58
1.3K reviews
Reviewsdown 0.2 percent−0.2%
1.3K
Version
2.0
Manifest V2
History
3 snapshotsTracking since Apr 1, 2026.
Not enough history yet for this metric — the chart fills in as we collect more snapshots.
View as table
| Date | Users | Rating | Reviews | Version |
|---|---|---|---|---|
| Apr 1, 2026 | — | 4.58 | 1.3K | 2.0 |
| Apr 29, 2026 | 3.0M | 4.58 | 1.3K | 2.0 |
| May 27, 2026 | — | 4.58 | 1.3K | 2.0 |
| Now | — | 4.58 | 1.3K | 2.0 |
Permissions & access
- Permissions
- None declared
- Host access
- None declared
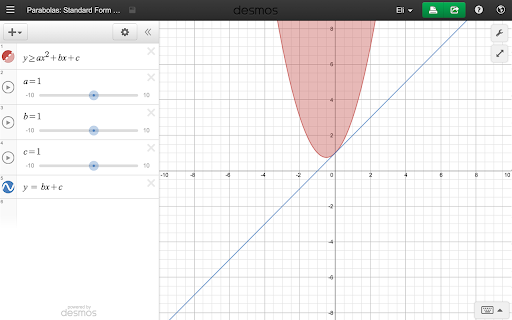
Screenshots


About
Explore math with Desmos! Plot functions, create tables, add sliders, animate your graphs, and more -- all for free.

At Desmos, we imagine a world of universal math literacy and envision a world where math is accessible and enjoyable for all students. We believe the key is learning by doing.

To achieve this vision, we’ve started by building the next generation of the graphing calculator. Using our powerful and blazingly-fast math engine, the calculator can instantly plot any equation, from lines and parabolas up through derivatives and Fourier series. Sliders make it a breeze to demonstrate function transformations. It's intuitive, beautiful math. And best of all: it's completely free.

Features:

Graphing: Plot polar, cartesian, or parametric graphs. There’s no limit to how many expressions you can graph at one time - and you don’t even need to enter expressions in y= form!

Sliders: Adjust values interactively to build intuition, or animate any parameter to visualize its effect on the graph

Tables: Input and plot data, or create an input-output table for any function

Statistics: Find best-fit lines, parabolas, and more.

Zooming: Scale the axes independently or at the same time with the pinch of two fingers, or edit the window size manually to get the perfect window.

Points of Interest: Touch a curve to show maximums, minimums, and points of intersection. Tap the gray points of interest to see their coordinates. Hold and drag along a curve to see the coordinates change under your finger.

Scientific Calculator: Just type in any equation you want to solve and Desmos will show you the answer. It can handle square roots, logs, absolute value, and more.

Inequalities: Plot cartesian and polar inequalities.

Visit www.desmos.com to learn more.
Technical
- Version
- 2.0
- Manifest
- V2
- Size
- 8.63KiB
- Min Chrome
- —
- Languages
- 1
- Featured
- No
Metadata
- ID
- bhdheahnajobgndecdbggfmcojekgdko
- Developer ID
- u7d8e06252878fd2e1a087422e7912332
- Developer Email
- [email protected]
- Created
- Jun 19, 2011
- Last Updated (Store)
- Dec 11, 2014
- Last Scraped
- May 27, 2026
- Website
- desmos.com
- Privacy Policy
- —
Similar extensions
Alternatives to Desmos Graphing Calculator, ranked by description similarity.
GeoGebra Graphing Calculator
Graph functions, investigate equations, and plot data with our free graphing app
—
★ 4.4
Unknown
—
Desmos Sidebar
Allows for graphing calculator to be launched on any global site
5.0K
★ 5.0
Desmos Unlocked
Browser extension for better user control of the Desmos graphing calculator configuration
2.0K
★ 4.0
MathStudio
Math for the modern web browser.
—
★ 4.3
DesModder for Desmos
Supercharge your Desmos graph creation and sharing experience with many convenient features
9.0K
★ 5.0
Desmos Dragger - Graphing Calc on Any Website
Summons a draggable graphing calculator on any website.
30
★ 4.5
Equatio - Math made digital
Easily create mathematical equations, formulas and quizzes. Intuitively type or handwrite, with no tricky math code to learn.
2.0M
★ 3.9
Data sourced from the Chrome Web Store · last verified May 27, 2026.